As we move into February it is always prudent in our view to look into how the market has performed historically. Our Avory Stock Market Seasonality Report helps gauge historical S&P 500 performance over the last 50 years.
We are interested to see how the stock market performs on specific days, weeks, months, and even quarters. Here are the main takeaways as we exit January and look ahead to February.
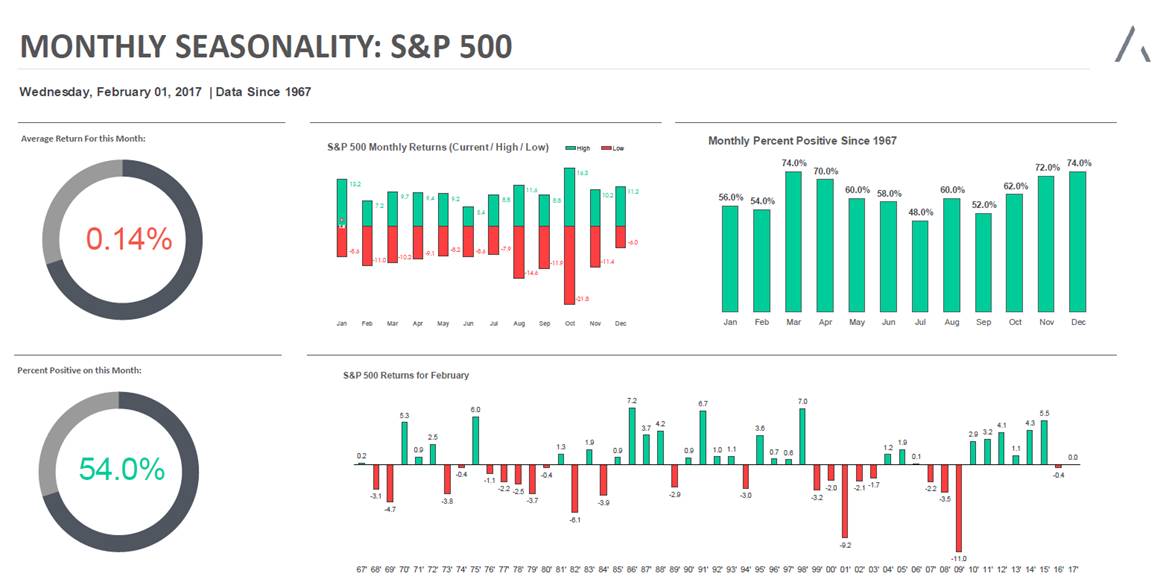
Avory Seasonality Report (50 years of data) – February
- The S&P 500 (INDEXSP:.INX) just saw its least volatile January in 50 years.
- A positive January has led to a positive final 11 month return 88% of the time. (h/t Ryan Detrick)
- The month of February is up slightly on average, +.14%.
- On average, the month of February is up 54% of the time, the 3rd worst of any month.
- 6 of the last 7 February’s have been positive. Last year was negative.
- The worst February was -11% in 2009. Second worst was -9.2% in 2001.
- The best February was a +7.2% gain in 1986… Five Years into Reagan’s campaign.
- Only once over the last 15 years was February red after January was green (2007). (h/t Ryan Detrick)
- During post-election years, February tends to be a weaker month.
- Q1 on average is up 2.84%, and up 62% of the time.
Below you will find more statistics regarding February stock market seasonality vs. all months.
Thanks for reading.
Twitter: @_SeanDavid
Any opinions expressed herein are solely those of the author, and do not in any way represent the views or opinions of any other person or entity.


: Showing Some Signs of Emerging Strength")
