Growth vs Value Investing Relative To Your Age
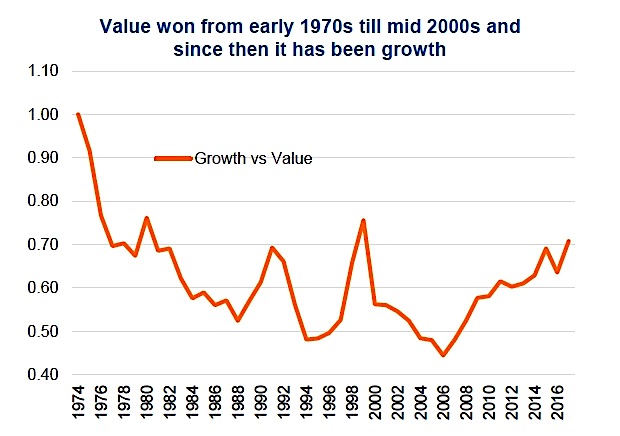
It should not be lost on investors that in 2017 the S&P 500 Growth Index outperformed the S&P 500 Value Index by 13% (+25.4%...
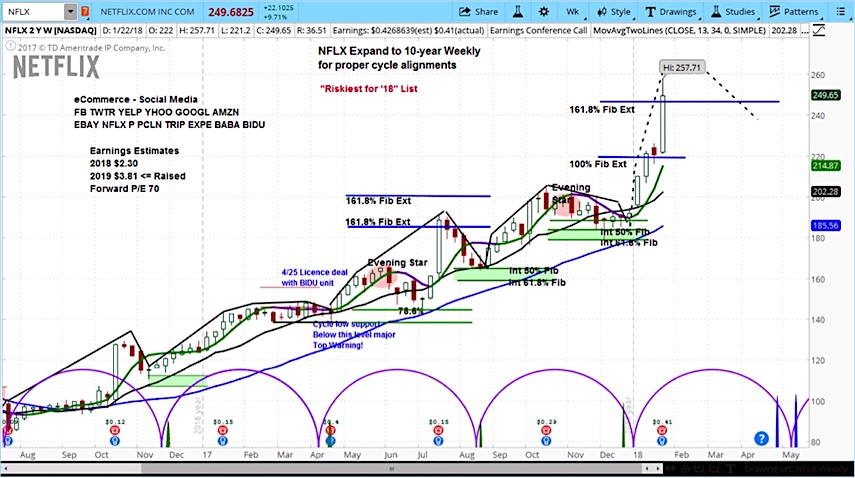
Netflix (NFLX) Surges On Q4 Earnings, Stock Valuation A Risk
Entertainment company Netflix (NFLX) is up over 10% today after posting Q4 earnings per share of 41 cents and revenue of $3.29 billion versus...
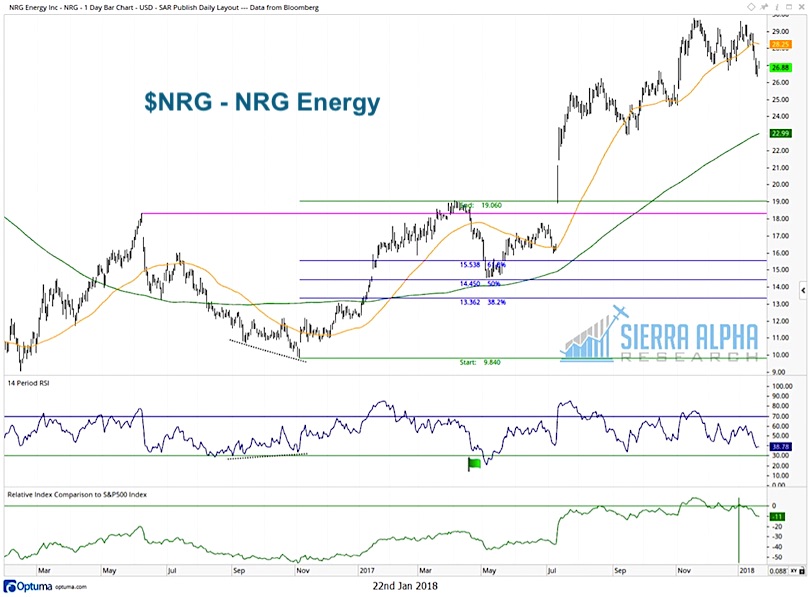
Reviewing The Leaders Of 2017: The Top 5 S&P Stocks
I gave a presentation at the 2017 Behavioral Finance Symposium entitled “The Mindless Investor and the Mindful Investor.” I discussed ways to apply the...
Market Futures Trading Outlook For January 23
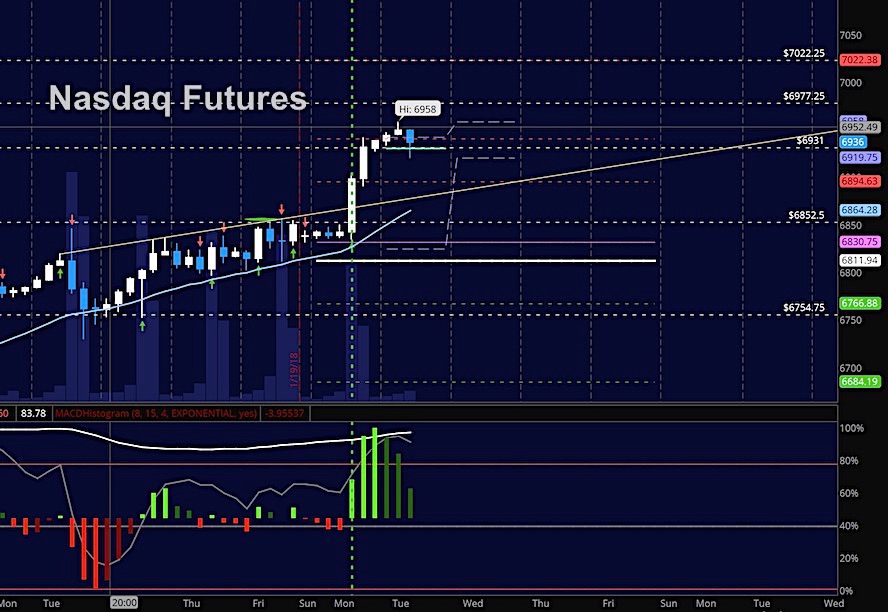
Broad Market Outlook for January 23, 2018
The bullish price action is extending as short positions are squeezed. Keep an eye on price support levels noted...
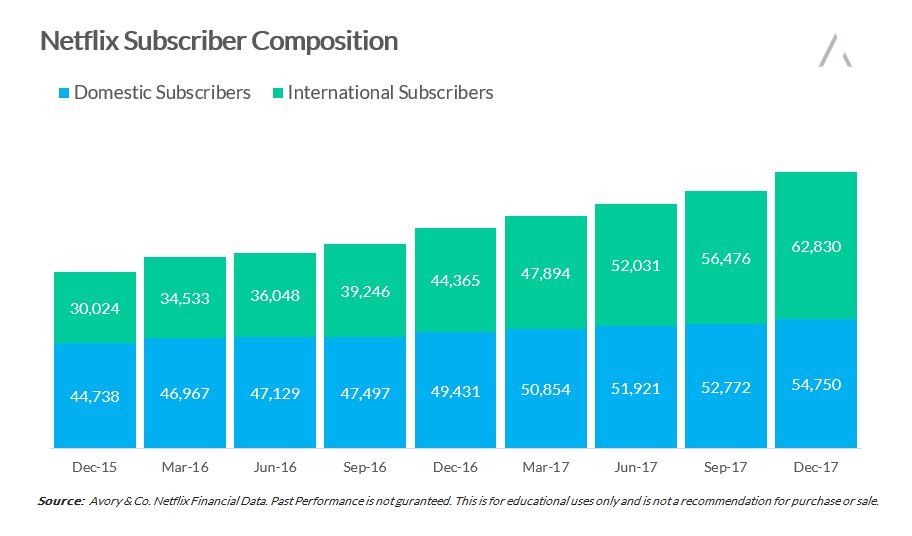
Netflix Q4 Earnings Fueled by Subscriber Growth – CIO of Avory & Co.
Netflix (NFLX) reported Q4 quarterly earnings after the bell today.
The company posted an exceptional quarter led by their subscriber numbers. The following research and...
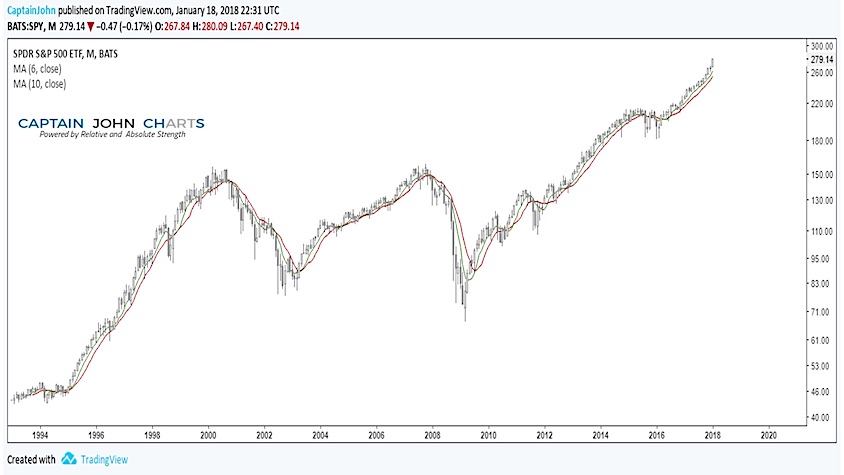
Market Synchronicity and MA Crossovers Point Higher For Stocks
The ETF's of several major stock market indices are moving higher in synchronicity. And this is bullish from a macro perspective.
Using one of our...
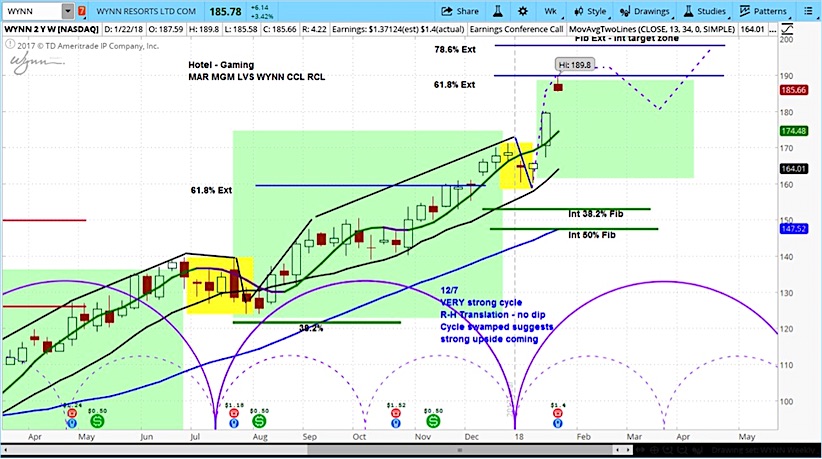
Wynn Resorts (WYNN) Beats Earnings: Look For Pause, Then Higher
WYNN up 3% after beating on earnings and revenue
Wynn Resorts (WYNN) announced earnings per share of $1.40, compared to the expectation of $1.36....
Stock Market Trends Review & Outlook (Week 4 / 2018)
THE BIG PICTURE
The S&P 500 has been rallying up a vertical wall since the start of 2018. All major stock market indices continue to...
Copper Stocks Aren’t Buying Dr. Copper’s Rally
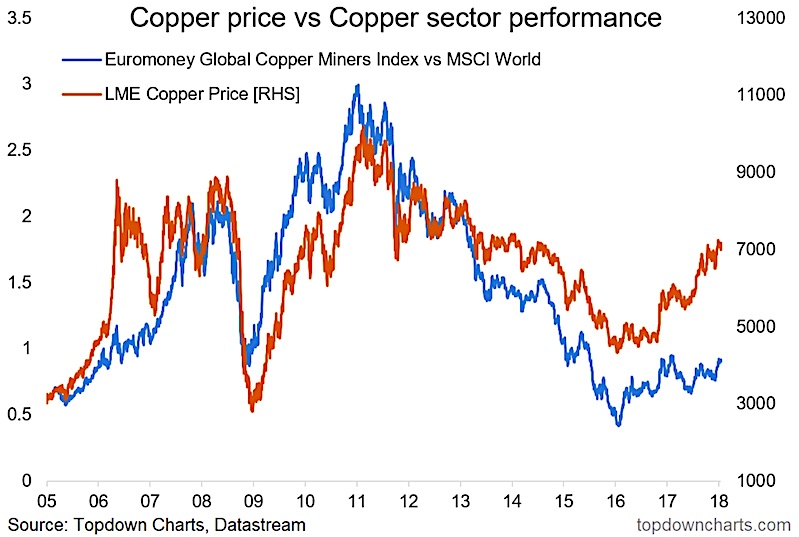
Something interesting has been going on in one of our commodity intermarket models. While the price of copper has surged back from the lows of...
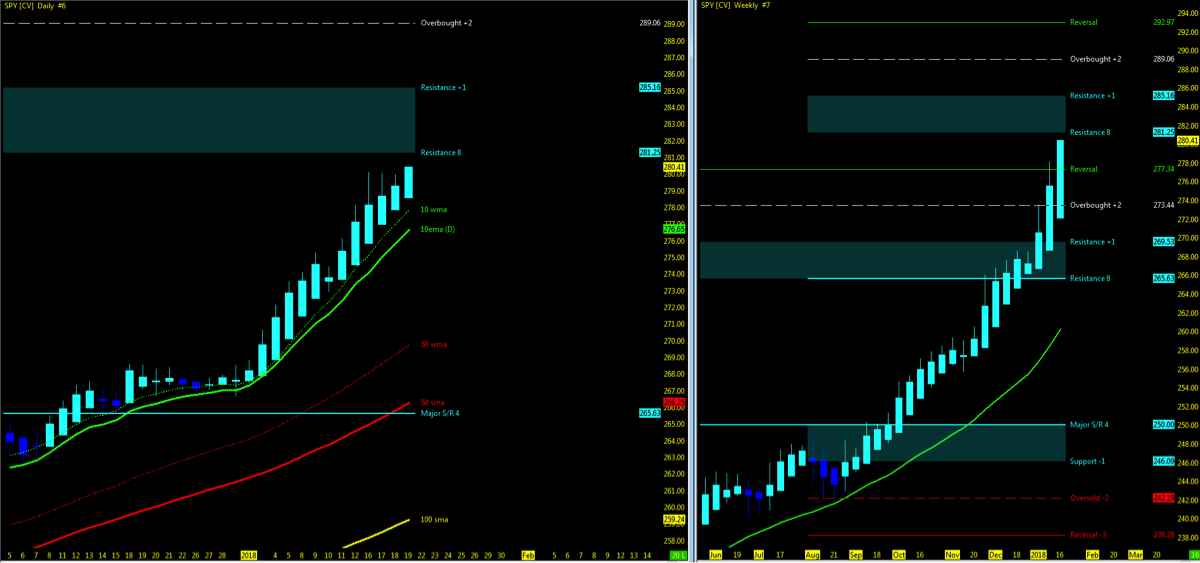
S&P 500 Market Cycle Outlook: Minor Correction This Week
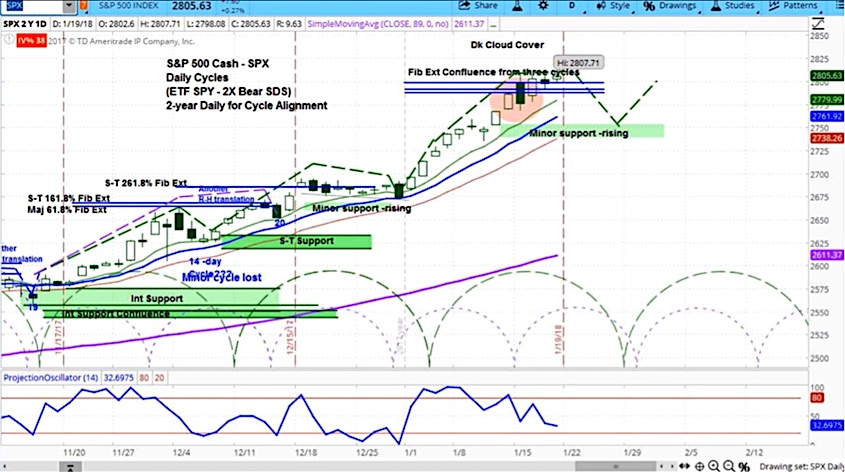
The S&P 500 pushed a bit higher last week as the vertical bull market continues. But recent gains have not come without some near-term...

