THE BIG PICTURE
The S&P 500 has been rallying up a vertical wall since the start of 2018. All major stock market indices continue to make new all-time highs and remain in up-trends. Market strength has persisted for much longer than most traders anticipated. This is why traders need to follow the price action (and indicators) and steer clear of the noise and opinions. When the market begins a pullback, your process should stop you out of the trade… and/or offer new looks on both the long & short side of trades.
Below is my weekly stock market futures trading update and trend outlook. Let’s start by looking at a chart of the S&P 500 ETF (SPY).
S&P 500 Chart – Week 4 (week of January 22)
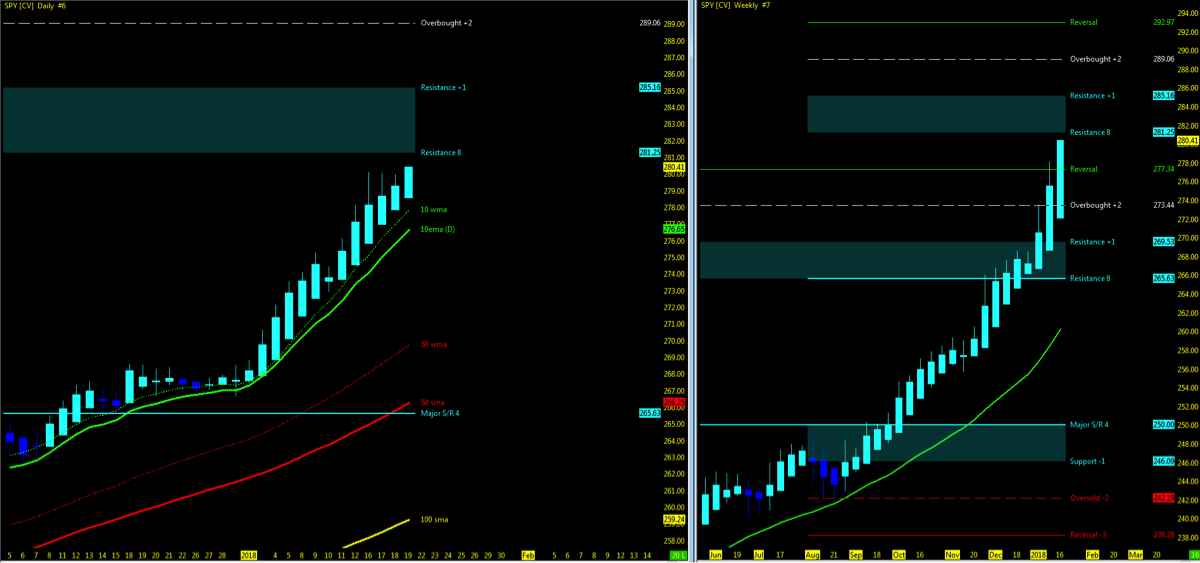
Using the Murray Math Level (MML) charts on higher time frames can be a useful market internal tool as price action moves among fractal levels from hourly to weekly charts. Confluence of levels may be levels of support/resistance or opportunities for a breakout move. Optimal setups will pass through Resistance or Support prior to moving in the opposite trend.
Technical Trends…
- Week 03 recap and trend charts
- Stock market indices at new all time highs.
- Several open gaps exist.
- VIX Volatility Index holding around 11.
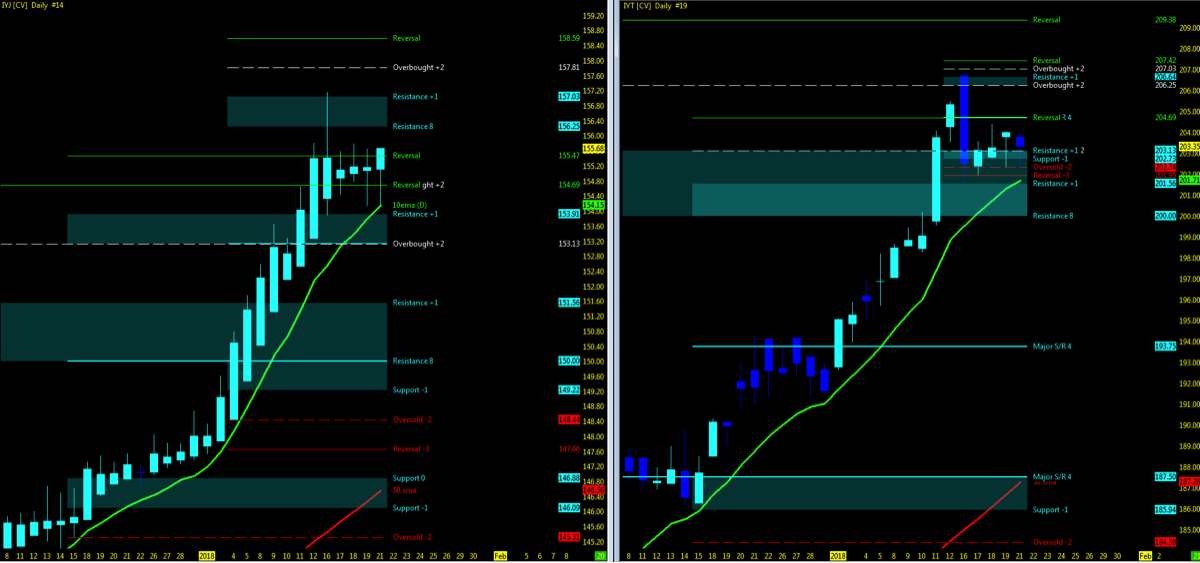
- Dow Jones Industrial and Transports
- Transports holding above 10ma after pullback; Industrials above 10ma after short term MML pullback
- Monitor for the two ETF indices to remain in sync upside as supporting indicator of uptrend momentum
Also see my Weekly Video Outlook
Key Events in the Market This Week
- USA: Earnings, GDP
- GLOBAL: NZ/Japan.Canada: CPI
- Q4 earnings:
- NFLX, Intel, CAT, GE
- Chip Sector
- Biotech
- Defense
THE BOTTOM LINE
Uptrend Technical Probability
- Key moving averages in sync on indices with no crossovers
- Indices remain at all time highs – go higher (IBD motto)
- VIX average low
- UUP – Dollar index momentum BIG PIC downside with downside MML targets
- FDN (Tech ETF) strong uptrend
- NYAD/INDU momentum upside
- VTI momentum strong upside
- IYJ/IYT remain in sync upside above 10ema
- Bloomberg Commodity index (BCOM) index has surged by nearly 6% since mid-December (@KennyPolacari)
Downtrend Technical Probability
- Downside Open Gaps
- Price action pushing at MML high resistance on both long and short term levels
- UUP – Dollar index momentum BIG PIC downside at support – poised for a pullback upside
- FFTY crawl back to highs – need a breakout to move to Uptrend Probability
- Technical indications (MACD) of an extended market (@EDUCOFIN)
- iPhone X sales not coming in as expected
- Bloomberg Commodity Index (BCOM); 6 sub-indices sectors above out of 18 total. $DJP in consolidation on daily chart
My 3 Cents
…A sustained bubble appears to be the new buzz word. If you’ve been listening to my rantings you know that I am not one to forecast the tops but to clearly identify when trend has changed and the probability of more to come appears to look better than not. While that moment has not come as of yet, I am in the crowd that while enjoying the sustained and impressive run, would appreciate a pullback for both shorting and looking for an opportunity to purchase at a lower price to the long side. There are some who run in my circle who don’t agree with me and think that the bubble is too much and the market needs to play by the laws of yesteryear. I say hogwash to that as the old rules are simply not in play anymore.
Back in 2007, I clearly saw what was a housing bubble and selectively pulled my funds out of the market at the tops. Some would even categorize me in the crowd that run with the bubble crowd today like back then and say….what bubble? My trend vision is quite focused and not compromised. I simply have two strategies. Long term ETF re-balance each quarter and intraday preparation for either direction. Until anything shows different, even though I agree wholeheartedly with you for a pullback, see technical momentum in one direction with probability that weights itself each week on both sides. When the scales shift, I will shout it from the mountain tops. But I know how many of you want to say that you were the first one to call it. Till then, let’s see if Q4 earnings in the next 2 weeks will give us the catalyst we desire.
Watch for MML setups on price action break above resistance high and back under resistance low for first signs of a pullback. Downside, watch for open gaps to be closed and 50% pullback as 1st level of support.
Attempting to determine which way a market will go on any given day is merely a guess in which some will get it right and some will get it wrong. Being prepared in either direction intraday for the strongest probable trend is by plotting your longer term charts and utilizing an indicator of choice on the lower time frame to identify the setup and remaining in the trade that much longer. Any chart posted here is merely a snapshot of current technical momentum and not indicative of where price may lead forward.
Thanks for reading and remember to always use a stop at/around key technical trend levels.
Twitter: @TradingFibz
The author trades futures intraday and may have a position in the mentioned securities at the time of publication. Any opinions expressed herein are solely those of the author, and do not in any way represent the views or opinions of any other person or entity.


