The S&P 500 pushed a bit higher last week as the vertical bull market continues. But recent gains have not come without some near-term concerns.
This week’s stock market commentary and cycle analysis highlights and discusses the prospects for a pause or pullback by week’s end.
S&P 500 Summary and Market Cycle Outlook:
- The S&P 500 moved higher last week, rising by 1.6%.
- Stocks declined last Tuesday, as Deutsche Bank opined that oversupply in the bond market could push equities lower in 2018.
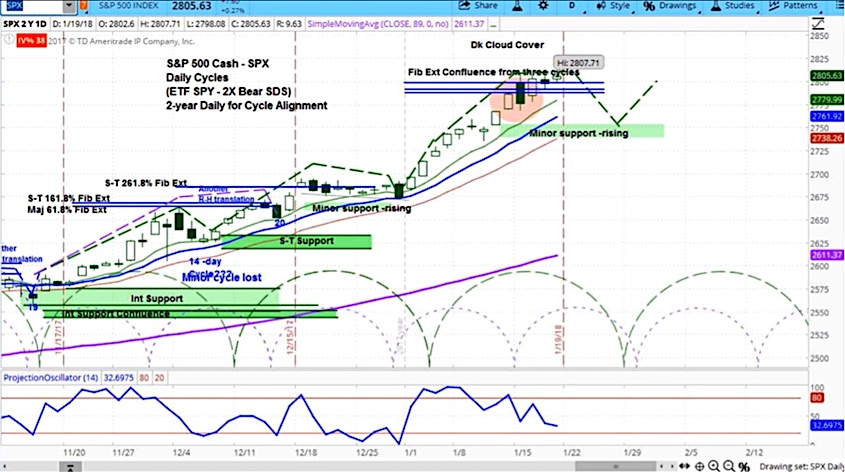
- Our projection this week is for stocks to decline to the 2753, as its current market cycle corrects.
The stock market moved higher last week, with the S&P 500 (SPX) up 24 points to 2810, another all-time high.
On Monday, the euro rose versus the dollar on reports of Angela Merkel’s progress in forming a coalition government between the Christian Democrats and the Social Democratic Party. This is part of a broader trend of weakness in the US dollar.
On Tuesday, Bitcoin dropped 20% on concerns of Chinese and South Korean regulatory risk. Likewise, one of China’s largest credit rating agencies downgraded US government debt from A- to BBB+, noting the government’s increased reliance on debt. US bond futures later fell by a full point.
Further, Deutsche Bank opined that a $1 trillion increase in the supply of US treasuries in 2018 could push interest rates higher and equities prices lower. After an early morning rally, the S&P 500 reversed by 35 points, sinking for most of the day.
On Wednesday, Apple (AAPL) ticked up by nearly $3, after it made news saying it would invest $350 million in the US economy over 5 years. At the same time, Bitcoin continued its move lower, dropping to nearly 9,000 and then recovering to close the day over 11,000.
On Thursday, the Labor Department announced that jobless claims had dropped to 220,000, which is a 45-year low. Also, the House of Representatives passed a continuing resolution to keep the government funded. Yet the Senate was unable to pass such a similar measure, leading to a government shutdown.
The daily chart above shows our projection for the S&P 500 (SPX) in the coming week: a decline to the rising minor support zone starting at 2753, as the current cycle corrects. The green-dotted half circles represent the short-term market cycles.
For a more detailed look at cycle analysis for a broader selection of futures, watch the askSlim Market Week every Friday afternoon.
Watch our latest askSlim Market Week Video:
Twitter: @askslim
Any opinions expressed herein are solely those of the author, and do not in any way represent the views or opinions of any other person or entity.


