Something interesting has been going on in one of our commodity intermarket models. While the price of copper has surged back from the lows of 2016, it seems that copper stock analysts don’t quite buy the rally.
A significant divergence between the copper price and copper stocks relative performance has opened up, and this is the kind of divergence that usually will end up closing one way or the other.
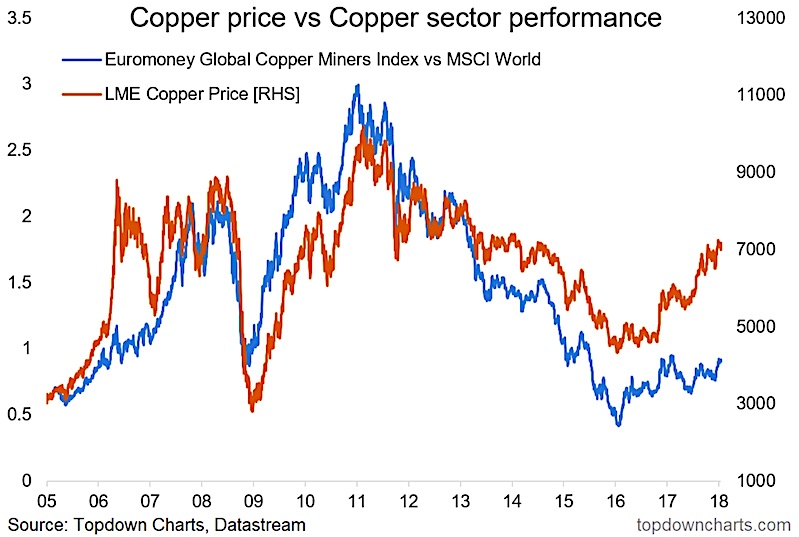
The chart comes from the latest edition of the Weekly Macro Themes report and was part of a wider discussion on global equity relativities and some of the extremes and opportunities such as this one. Look for this copper stocks divergence vs price to sort itself out in the weeks ahead.
The chart in question shows the LME Copper Spot price vs the Euromoney Global Copper Miners Index relative to the MSCI World Index.
Copper Price vs Stocks Chart
I study charts and intermarket relationships such as this one for a couple of reasons. First up is the information that it can bring on the actual commodity price. For instance, if copper stock relative performance is heading down then that can actually offer clues about what to expect from the copper price itself.
Copper stock relative performance is driven by investors who no doubt will be closely studying the profitability and financials of these companies along with the industry dynamics and will be scouring the wires for every detail that drives the copper industry and the individual companies.
This means this group of investors should have a view on where copper prices are going. So if they effectively disagree with where price has gone (based on lackluster relative performance) then that could be a sign. This seemed to be the case in the 2009-10 period just after the financial crisis, and 2013-15 into the commodity crunch.
By the same token, it can on the contrary uncover opportunities. These investors and analysts are equally liable to the various biases and extremes of investor sentiment and could end up too pessimistic (as in 2006 where copper stock prices lagged the price of copper… only to catch up dramatically later on in 2007.
Just goes to show, that however you interpret today’s chart, it pays to study the intermarket dynamics. Time will tell in which direction this divergence closes, and if China can hold growth steady again in 2018 then there could be another dramatic catch up on the cards for copper stocks. We’ll be looking closer at copper this week as commodities come front of mind.
Twitter: @Callum_Thomas
Any opinions expressed herein are solely those of the author, and do not in any way represent the views or opinions of any other person or entity.

: Showing Some Signs of Emerging Strength")
