I gave a presentation at the 2017 Behavioral Finance Symposium entitled “The Mindless Investor and the Mindful Investor.” I discussed ways to apply the lessons of mindfulness training as an investor, allowing you to learn from the past, focus on the present, and plan for the future.
One of my favorite ways to learn from the past is by reviewing top and bottom performers from previous years. If you have a formal benchmark, then you can use that universe. Otherwise, just use the S&P 500 index.
Reviewing the Leaders of 2017
In this exercise, we’ll review the S&P 500 names with the best performance in 2017. Did you own any of those names? For the ones that you did not own, was there anything along the way that could have signaled you to take a position? How are you screening for new ideas, and how could you have identified these top performing names earlier in their uptrends?
The top performing S&P name in 2017 was NRG Energy Inc (NRG), up 132%.
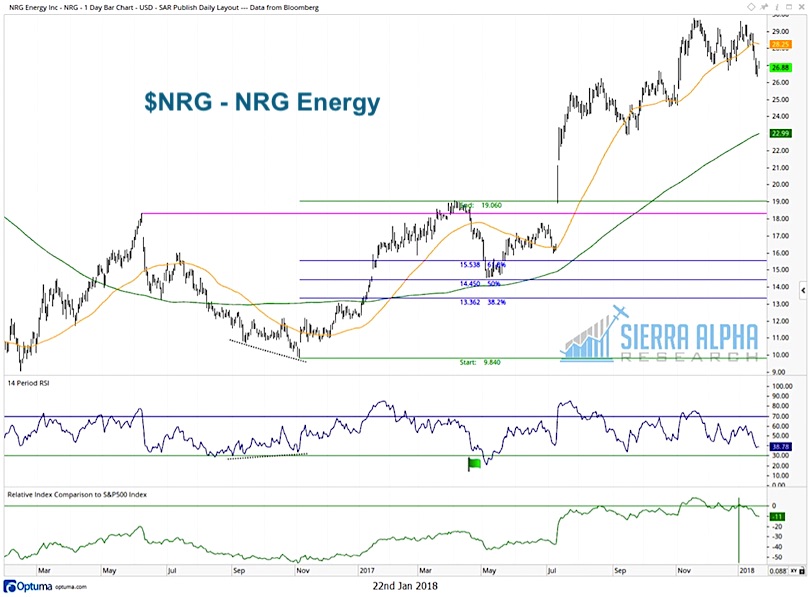
In early 2016, NRG lost almost half of its value, coming down from a peak around $18 to bottom out around $10 in November 2016. By April 2017, the stock had already round tripped to $19. Then after retracing almost 50% of that upswing, NRG gapped above $19 and never looked back.
What can we learn from this example? There was a bullish divergence with RSI at the November 2016 low. Soon after, the stock traded to a new 13-week high and above its 50-day moving average. Then in May 2017, the RSI became oversold when NRG neared the 50% retracement level. Both signals provided ideal entry points with further upside yet to come.
The second best name in 2017 was Align Technology (ALGN), which was up around 131% for the year.
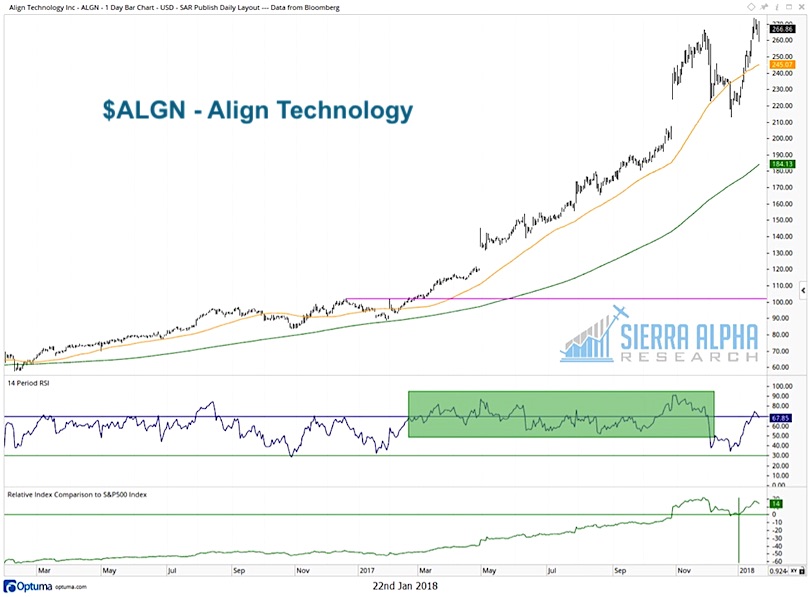
ALGN was a strong performer in 2016, and then the beginning of 2017 saw a pullback from the “big round number” of $100. Stocks often find support and resistance at big round numbers, often caused by the psychological significance of the value.
Once ALGN broke above this resistance level in May 2017, it continued on to a series of higher highs to eventually peak for the year around $260. During that uptrend, the RSI became extremely overbought (above 80) which usually suggests further price appreciation. The RSI also never moved below 50, confirming the strength of the uptrend.
Once a stock breaks out, that doesn’t necessarily mean it’s a completely missed opportunity. I often review the 13-week high list, not just for new names on the list, but also for those that show up regularly. In this case, we would have seen ALGN on the new high list many times during the year, providing a number of opportunities to consider a position.
The third best performer for 2017 was Vertex Pharmaceuticals (VRTX).
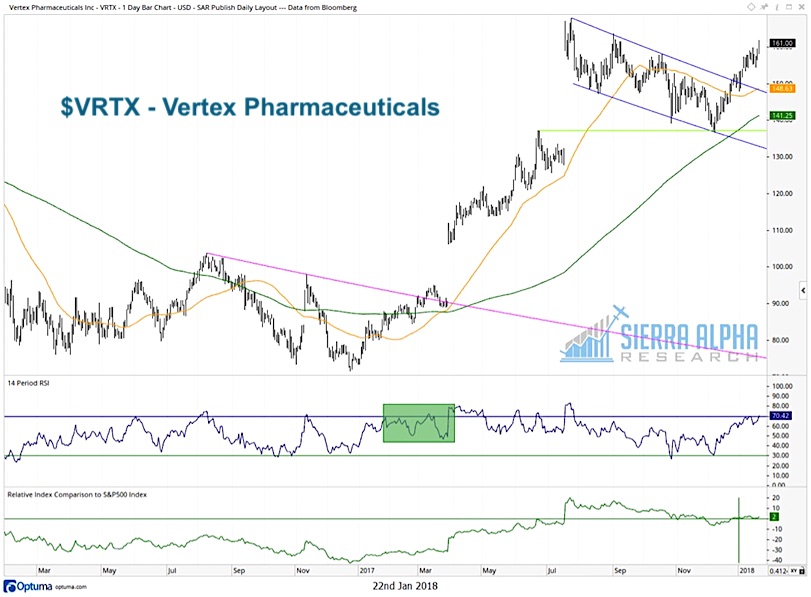
What jumps out here is the way the stock broke above its 50-day moving average in early 2017 with a “plain vanilla” series of higher highs and higher lows. Then in March 2017, the stock broke above the trend line (pink) using the 2016 highs. Once VRTX gapped above the $100 level in April, the uptrend quickly accelerated.
The lesson here? Look for stocks that begin a consistent uptrend after a double bottom in price. A break above the 50-day moving average can be an early signal of potential gains.
It’s worth noting that in 2018 VRTX has filled the gap from mid-2017 while showing a bull flag pattern. This bullish signal was confirmed with the breakout in December 2017, suggesting further upside this year.
The fourth best performer was Wynn Resorts (WYNN).
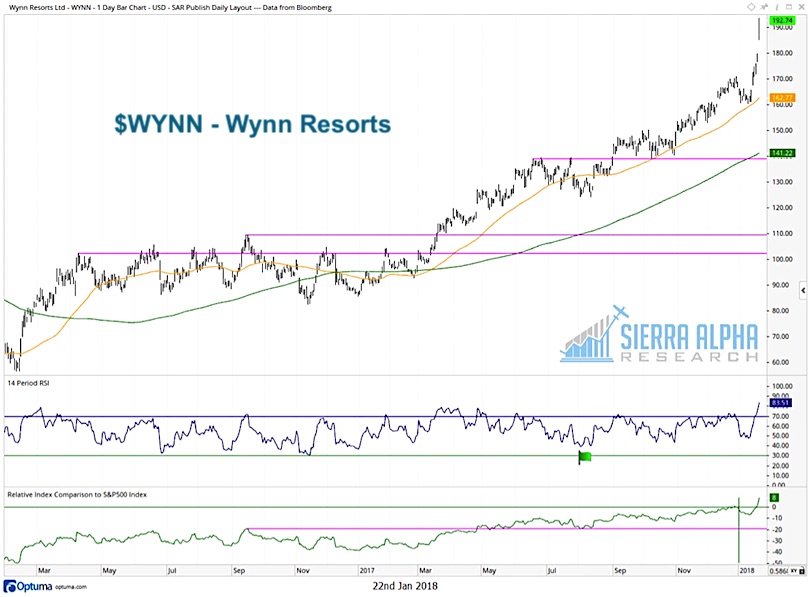
Here we have a classic “big base breakout” where the stock found resistance around $100 for almost a year. WYNN finally broke to new highs in April, setting the stage for a strong uptrend through the end of the year.
Here we see a textbook example of a stock in a price correction (mid-2017) where the RSI pulls back to the 40 level (green flag). In an uptrend, this RSI 40 level can often help identify buyable pullbacks
Finally, at fifth place we have Boeing (BA).
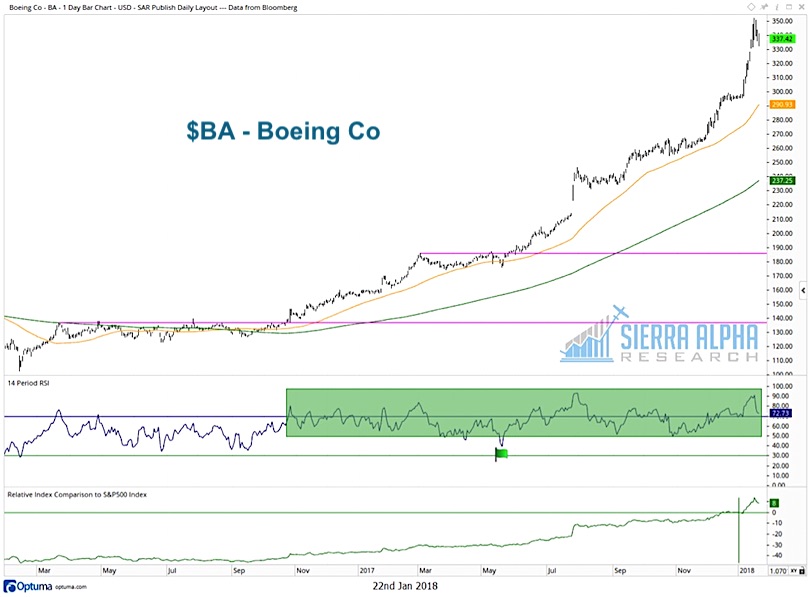
Here we see another “big base breakout” although the breakout actually occurred in late 2016. Note how the RSI remained above 50 for most of 2017, confirming the strength of the uptrend.
After BA found resistance around $185 in March 2017, the stock pulled back to its 50-day moving average. The RSI came down to around 40 (green flag) which often identifies entry points in a strong uptrend.
As investors, we often like to ignore our failures and instead focus on our successes. This exercise of reviewing top performers can help you reflect on how you identify long ideas, and how you minimize the chance of missing out on opportunities to outperform.
You can gain deeper insights and more meaningful analysis over at Sierra Alpha Research. Thanks for reading.
Twitter: @DKellerCMT
The author may have a position in mentioned securities at the time of publication. Any opinions expressed herein are solely those of the author, and do not in any way represent the views or opinions of any other person or entity.


