The ETF’s of several major stock market indices are moving higher in synchronicity. And this is bullish from a macro perspective.
Using one of our many technical analysis techniques we will show why this is bullish.
In this analysis the 6 MA/10 MA moving averages are used because buy/sell signals can be extrapolated by watching these for moving average crossovers. A bullish sign occurs when the 6-month moving average crosses above the 10-month moving average.
We will begin with SPDR S&P 500 ($SPY) and S&P MIDCAP 400 ($MDY) ETF’S.
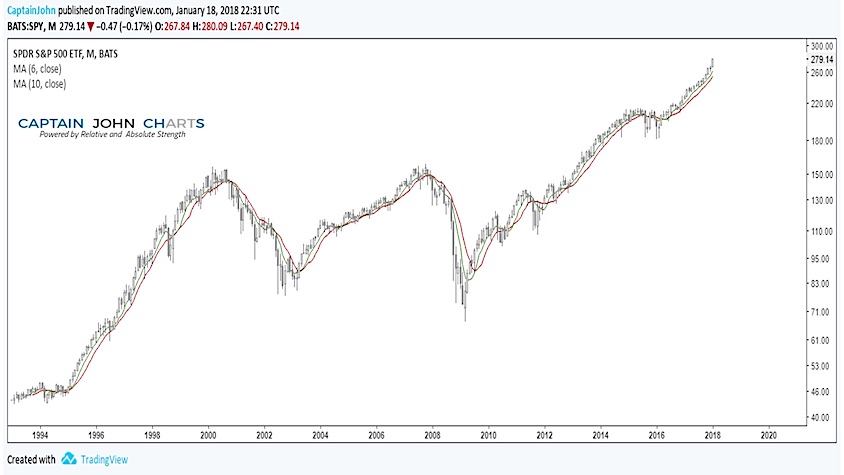
$SPY ETF
- The conditions in both $SPY and $MDY initially appear to have moved far above the MA line, but are not yet over extended, per se.
- The 6-month is still above the 10-month favoring bullishness.
- The $SPY ETF Point and Figure chart shows a Long Tail Up pattern since 12/18/17, which may or may not be a sign of exhaustion, so it’s important to look at other factors.
- The bullish objective of the $SPY Point and Figure chart of $265 has been met.
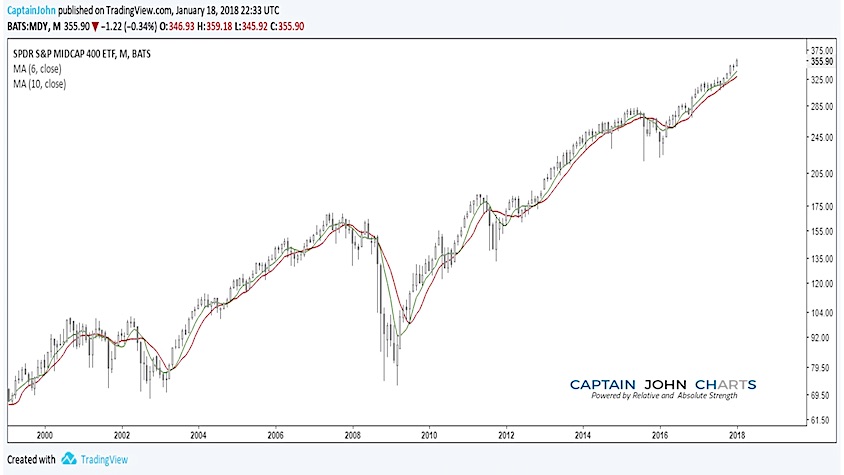
$MDY ETF
- The crossover system still shows the 6-month MA as bullish in the $MDY stock chart.
- The Ascending Triple Top Breakout on 12/26 is still in play with a bullish price objective of $390.
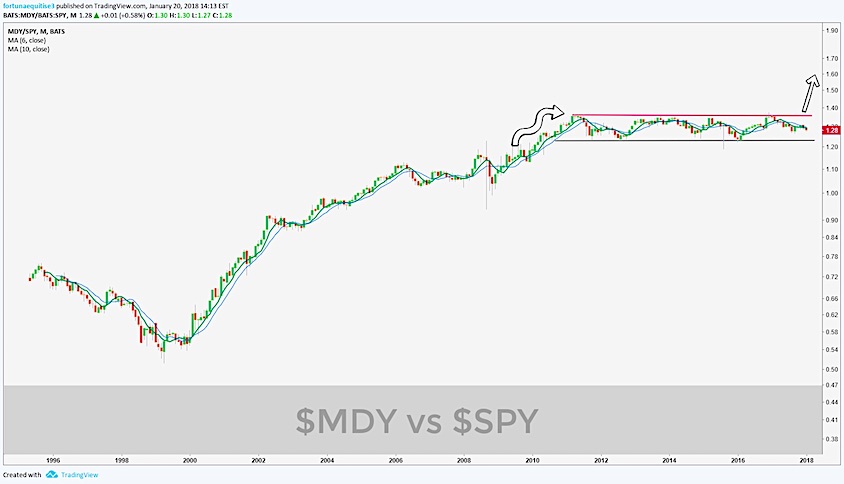
RELATIVE COMPARISON: $MDY vs $SPY
SPDR MID CAP 400 vs. SPDR S&P 500 ETF
The comparison below is a long term Monthly stock chart comparing $MDY vs $SPY ETF to reveal which index is stronger.
Takeaways:
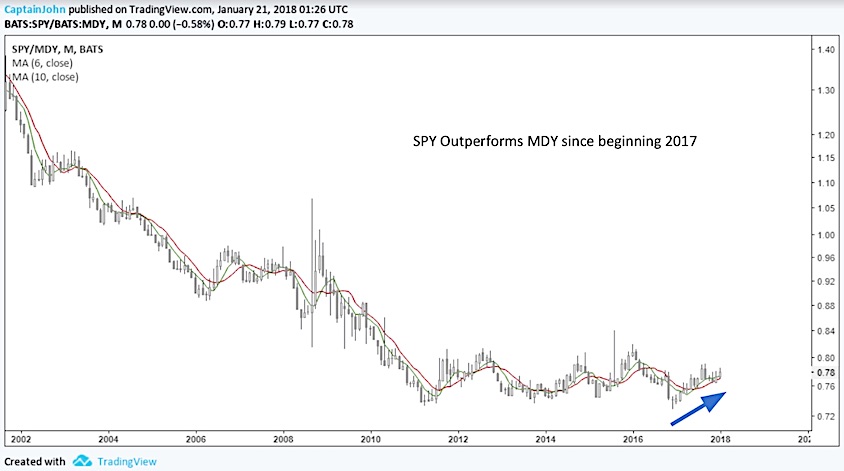
- $SPY vs. $MDY long-term underperformance after 2000 has traded in a range underperforming the $MDY Mid-caps ETF until 2012. Now they are switching with $SPY moving in lead yet both still bullish in synchronicity.
- A very recent uptrend can be easily seen in a $SPY vs $MDY comparative chart, suggesting $SPY will continue to outperform $MDY.
Takeaways:
- The Bullish Percent Index of $SPX is showing nearly 82% of $SPX stocks on a bullish signal.
- $MDY/$SPY entered a range bound area, but did so from an uptrend, making this area one to watch for near term breakouts from the top of the range.
- Mid Caps are poised to continue to perform but for now $SPY ETF appears to be the leader.
RELATIVE COMPARISON: $QQQ vs. $IWM
Powershares QQQ Trust $QQQ and iShares Russell 2000 ETF $IWM
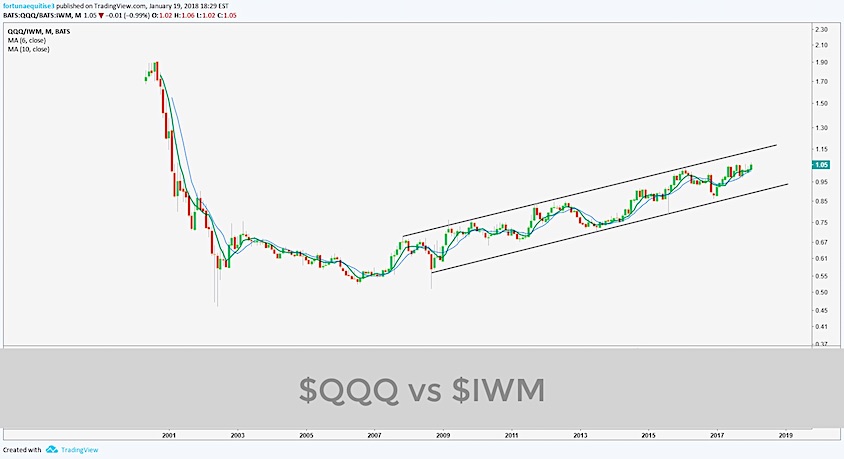
Takeaways:
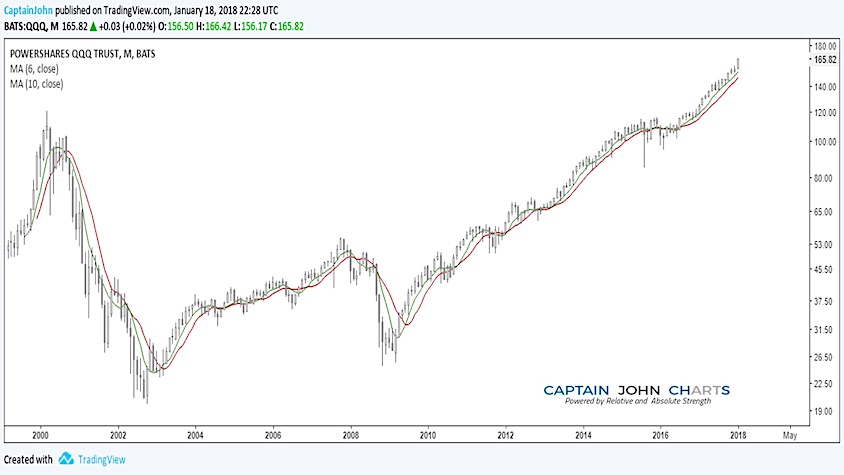
- The Q’s have outperformed $IWM for quite some time and moving in a bullish upward trend channel and are outperforming $SPY ETF.
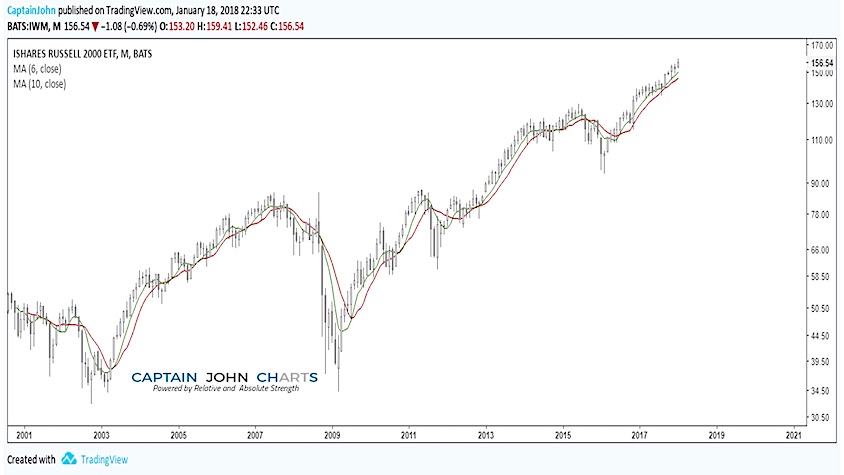
- On each monthly chart, with the 6month -10month crossover overlaid, the 6-month is still bullishly above the 10-month.
- QQQ is at the end of the objective of the Ascending Triple Top breakout back in July 24th, 2017 on a point and figure chart.
- Expect IWM to continue to underperform $QQQ.
Using the 6 & 10 MA crossover as a tool you can find:
- Better exits or entries.
- Uncover leaders, laggards and losers.
- Know where to begin your hunt within Indices.
- Gain better timing at adjusting your client’s or own portfolio’s.
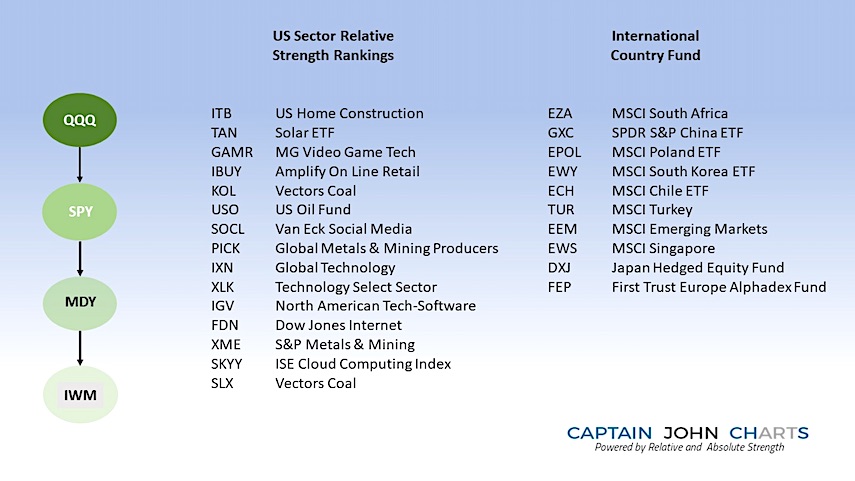
This week’s takeaway is that the strength is in the U.S. Equities markets is still bullish and moving in synchronicity; with QQQ ETF in the lead followed by SPY, MDY, and IWM. For reference we have a chart below showing the US Sector Relative Strength Rankings and International Country Funds.
Hope this information was informative and answered your questions about the direction the stock market is taking.
If you are interested in learning more about our investing approach and financial services, visit us at CaptainJohnCharts.
Twitter: @CptJohnCharts & @FortunaEquitis
The author may have a position in mentioned securities at the time of publication. Any opinions expressed herein are solely those of the author, and do not in any way represent the views or opinions of any other person or entity.


