Top Technical Trend Trading Ideas: Square Stock (SQ)
$SQ Square Stock Chart Technical Analysis
One of our top technical ideas here is Square (SQ) currently trading at $87.70.
Square is trading above the rising...
Stock Market Today: Increase In COVID-19 Cases Rattles Investors
As we begin the new week, stock market futures are lower and an increase in volatility looks likely.
Investor concerns appear focused on the increase...
2020 Providing Plenty of Volatility but Little Progress
Key Stock Market Takeaways:
- Knowing the ride keeps investors leaning in the right direction
- Consolidation could provide breadth leadership and renewed skepticism
- Copper suggest...
Chart of the Week: The Importance of User Experience
“I learned that it is better to do one product well than two products in a mediocre way.” – Reed Hastings
Throughout the COVID-19 crisis,...
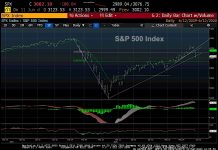
S&P 500 Index Trading Outlook: Will Sharp Decline Find Buyers?
S&P 500 Index INDEXSP: .INX Trading Chart
S&P 500 Trading Outlook (3-5 Days): Looks right to buy into Thursday's weak close for early strength on Friday, but Support...
The Federal Reserve’s Monetary “Animal House”
“…seven years of college down the drain.” – John “Bluto” Blutarsky, Animal House
The inspiration and credit for this article belongs to Emil Kalinowski and...
Chart of the Week: Financial Sector ETF (XLF) Faces Key Resistance
With all eyes on the Fed this week, along with all of the other macro influences, I’m digging into the charts and noticing the...
Stock Market Today: Breadth Metrics Flash Near-Term Warning
Stocks turned mixed on Wednesday as indices outside the Nasdaq continued to tread water.
This, coupled with near-term breadth metrics may be sending a warning...
Stock Market Outlook: Will Nasdaq Stall At 10,000?
The S&P 500 Index shows a strong bullish intermediate posture with a bullish short-term pattern on its Market Forecast study.
The two-day weakness hasn’t...
Investor Complacency Has Consequences
When stocks trend higher, investors enjoy the spoils.
Especially toward the end of the trend (on any timeframe). And it becomes easier to notice the...


