The stock market is showing resiliency in the face of the recent selloff.
Clearly, the major stock market indices were overbought and a pause in the action was inevitable.
Thus far, the pullback hasn’t been too severe. This has both bulls and bears wondering if this 3 week pause is over. The issue is that it’s unclear (as of now) if there is another leg lower that could finish off the pullback.
Today, we focus on an important sector that is mimicking that same juncture and should be an indicator of which way that move is. That sector is the Financial Sector (XLF).
Note that the following MarketSurge charts are built with Investors Business Daily’s product suite.
I am an Investors Business Daily (IBD) partner and promote the use of their products. The entire platform offers a good mix of tools, education, and technical and fundamental data.
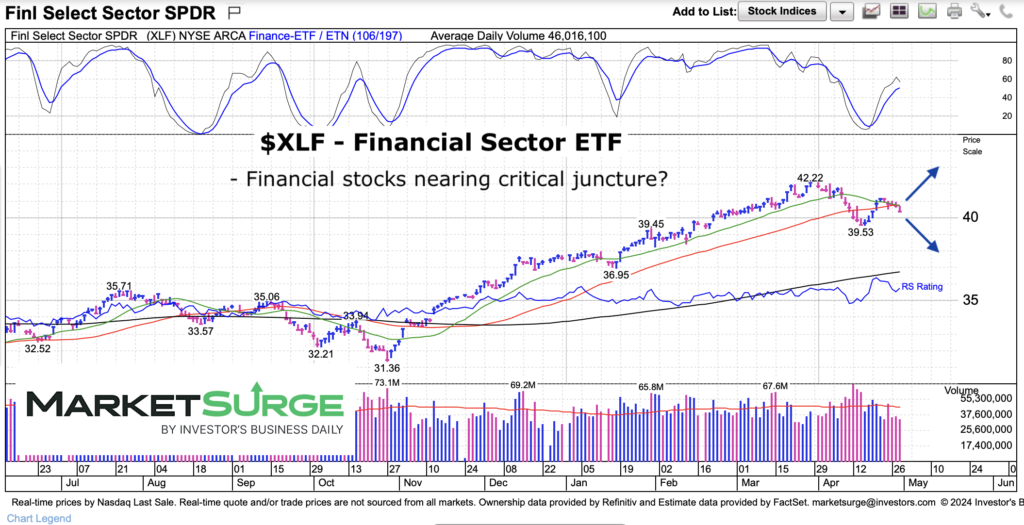
$XLF Financial Sector ETF Trading Chart
There are several important sectors to follow to monitor the health of the stock market and broader economy. One that is often followed as a broader indicator is the banking or financial sector.
So here we are!
Below is a chart of the Financial Sector ETF (XLF). And not much needs to be said other than XLF is nearing a decision point of heading higher (ending the pullback) or heading lower for one more move to extend the selloff. This is a good one to watch in the coming week, in my opinion.
Twitter: @andrewnyquist
The author may have a position in mentioned securities at the time of publication. Any opinions expressed herein are solely those of the author, and do not in any way represent the views or opinions of any other person or entity.


