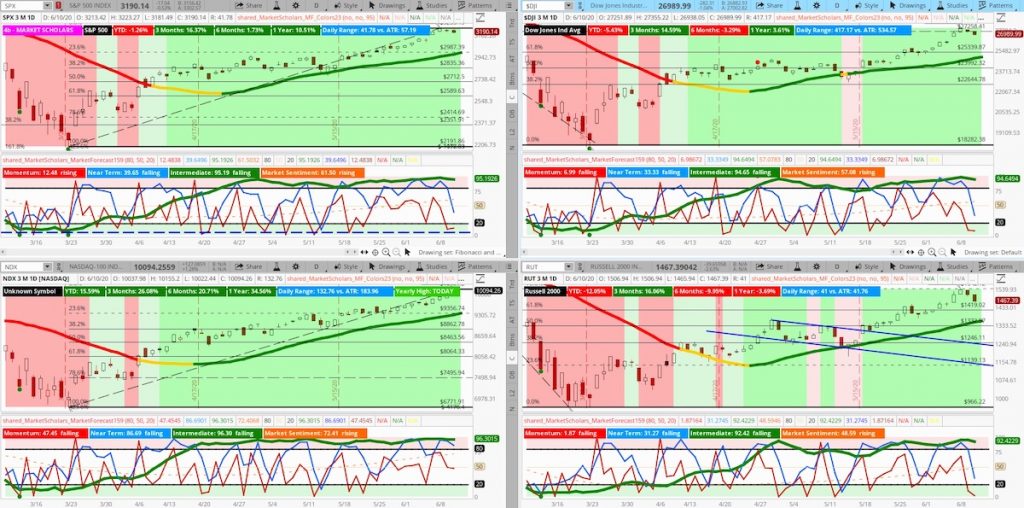
The S&P 500 Index shows a strong bullish intermediate posture with a bullish short-term pattern on its Market Forecast study.
The two-day weakness hasn’t even declined to the 23% Fibonacci retracement level of the near-term run that started nearly three weeks ago.
Get market insights, stock trading ideas, and educational instruction over at the Market Scholars website.
The S&P 500 can drop 7.5% without breaking below the 23% Fibonacci retracement price level of its bullish run off the March 23 low point.
Combined with a still elevated $VIX, this pattern suggests the S&P 500 can experience bigger moves that would still be considered noise.
The S&P is forming a golden cross on its 10-week and 40-week EMAs. Many times, after this pattern is formed, the S&P will re-test its 200dma – which, coincidentally, sits right around its 23% Fibonacci retracement level.
The same price area of short-term technical support is also bolstered by the midpoint of its four-week trading range.
The NASDAQ hit 10K. Major indexes still to stall for a time after hitting major round numbers.
The Fed’s statement today to hold interest rates at zero for multiple years should come as no surprise. There is precedent for the Fed to maintain a zero interest rate policy with an active quantitative easing program as the S&P 500 forms new all-time highs.
In the past, this has been a major tailwind for risk appetite – especially for large-cap tech sector and Emerging Markets. Inflation expectations remain abnormally low, which puts pressure on yields and, as a result, the Financials sector.
Market Outlook Video – June 10, 2020
Twitter: @davidsettle42 and @Market_Scholars
Any opinions expressed herein are solely those of the author, and do not in any way represent the views or opinions of any other person or entity.


: Showing Some Signs of Emerging Strength")
