With all eyes on the Fed this week, along with all of the other macro influences, I’m digging into the charts and noticing the Financial Sector ETF (XLF) is at a key decision point.
Either financials are able to continue the uptrend in price and relative strength, propelling the XLF above its 200-day moving average, or the sector takes a well-deserved pause as investors digest all the recent gains.
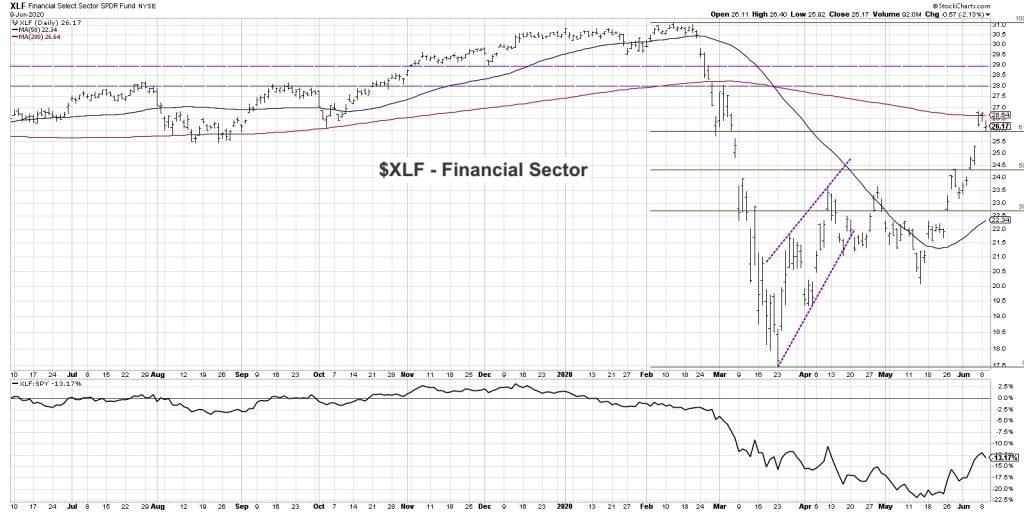
The bottom panel shows the relative performance of the financial sector.
What’s interesting here is that since the beginning of the year, the XLF has actually been in a relative downtrend for the most part (up until mid-May).
During the market sell-off, and even with the market recovery, the financial sector just could not figure out a way to outperform.
Price rallied fairly well out of the market lows, so the only time that the relative strength stabilized was coming out of the March 23rd bottom. The XLF rallied in lockstep along with all the other sectors, and recovered about 38.2%, which is the first Fibonacci retracement level notated in green.
After this low, it started to stabilize and broke to new swing lows as other stocks were continuing to improve in April and May. This pushed the relative strength trend even lower.
But something really interesting happened about 3-4 weeks ago.
The outperformance of technology started to back off a little bit, so the XLK (which had been a consistent outperformer) saw its relative strength start to turn lower. On the other hand, things like energy, financials and industrials, all started to rally. These are more of the “value-y” types of sectors that had been underperformers and have now just recently emerged as outperformers.
The reason why the XLF is my One Chart for today is because it’s at a critical juncture.
The price has now recovered just over 61.8% of the way up, which means it’s back above its last Fibonacci retracement level. This technically clears the way to retest the previous highs just above 31 on the XLF.
What’s happened now is the price is right above that 61.8% retracement level. The XLF has sputtered a bit in the last couple of days, and has failed to eclipse its 200-day moving average.
I see two potential scenarios here:
Option 1: This momentum that we’ve seen over the last 3-4 weeks continues, and after a brief pause, we break above the 200-day moving average which I would argue clears the way to retest the previous highs.
Option 2: The XLF is unable to materially break higher above its 200-day moving average, and breaks back below the 61.8% retracement level which would clear the way for lower lows. This could push the price back down to the 50-day moving average as well as the 38.2% retracement level.
We’ve seen a rotation away from technology into financials and energy, and now we’re at that point where we need to decide whether financials continue to perform well and resume this relative uptrend, or they are unable to eclipse the 200-day moving average and start to break to new swing lows.
If you ask me which scenario I would expect, I think we’re going to get a little bit of both. I wouldn’t be surprised if we get a bit of a pullback here, and that’s because so many areas of the market are overbought, especially the broad S&P 500 with an RSI above 70. Many stocks within technology and other sectors are all overbought which would suggest probable pullback.
Overall the price momentum has remained fairly positive and as long as the financial sector remains in a pattern of higher highs and higher lows, I think it’s a pretty decent bet that it will continue to do well. Short-term pullback then a resumption of the uptrend seems to be the path of least resistance here.
But first the XLF will need to eclipse its 200-day moving average… and that’s why it’s my One Chart for today.


