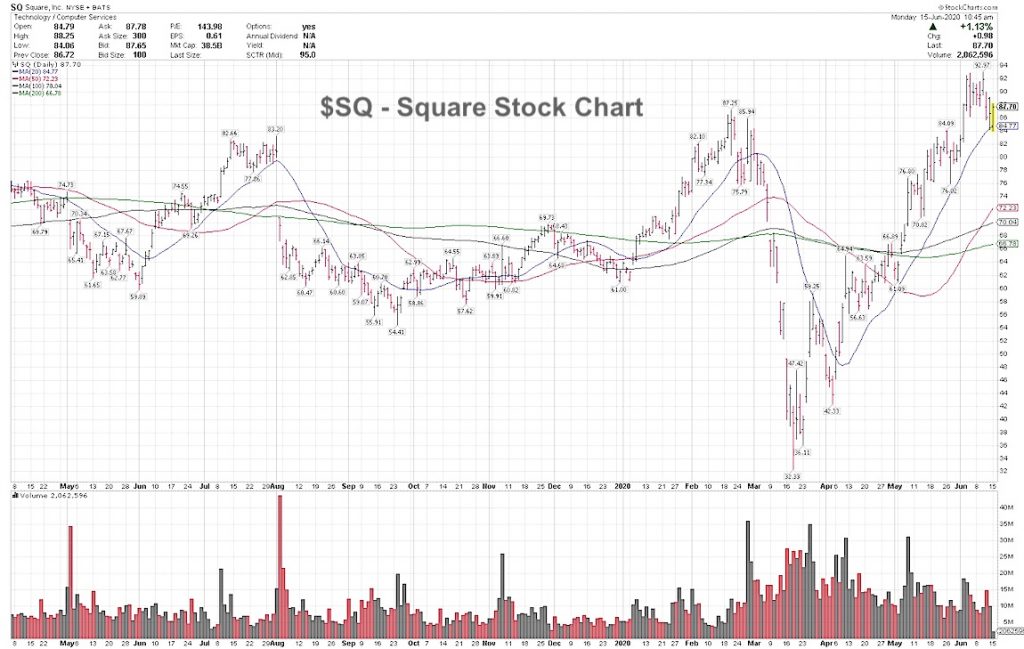
$SQ Square Stock Chart Technical Analysis
One of our top technical ideas here is Square (SQ) currently trading at $87.70.
Square is trading above the rising 20, 50, 100 and 200-day moving averages, indicating a strong uptrend on multiple time-frames.
Square just completed a 9% pullback after breaking out to a new 20-month high, and looks to be setting up here for another breakout.
For intermediate to longer-term position traders, $76 is key support on any pullbacks, and the rising 50-day moving average, currently at $72.22, is a key level for longer-term trend followers and investors.
As with most stocks, overall market direction could be a factor, but the SQ chart is one of our top ideas here.
Disclosure: I am long SQ stock.
Larry is the publisher of the Blue Chip Daily Trend Report.
Twitter: @LMT978
The author has a long position in ticker SQ at the time of publication. Any opinions expressed herein are solely those of the author, and do not in any way represent the views or opinions of any other person or entity.


