The Continuing Saga of a Range-Bound Stock Market
I’m often asked whether I’m bullish or bearish on a certain market.
I always like to remind people that the market can go in three...
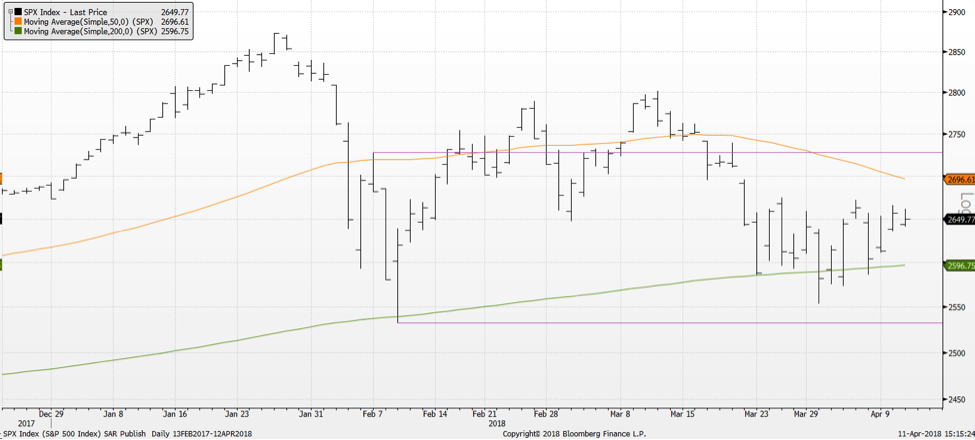
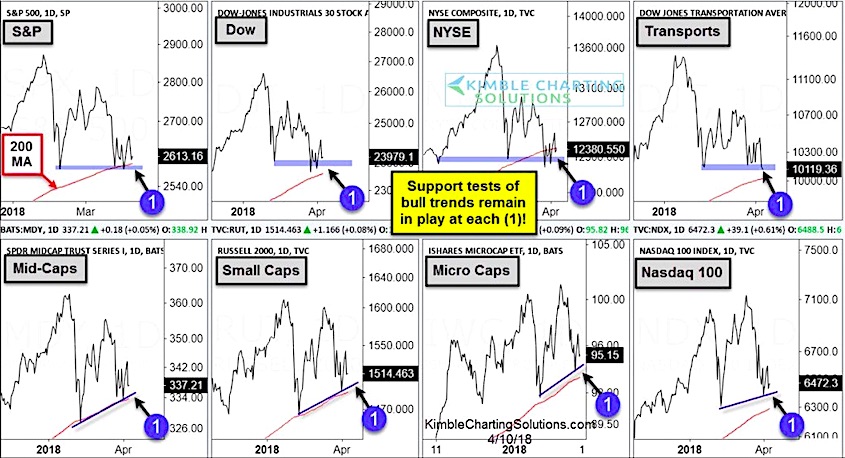
The Stock Market Is Holding Just Above Key Price Supports!
Stocks have been see-sawing and whipping around the past couple weeks, but one thing remains...
Stocks are holding on above key price support across several...
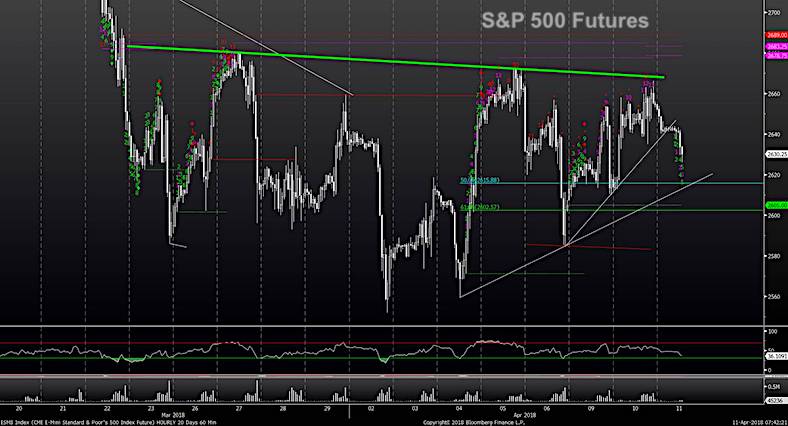
S&P 500 Technical Update: Is A Bullish Pattern Forming?
This is a 1-hour chart of the S&P 500, QQQ's, Midcap's (MDY), and Russell 2000 (RUT).
All of these key stock market indices are tracing out...
S&P 500 Market Outlook: Gold Shines, Stocks Holding On
Key Developments In The Financial Markets
Stocks continue to consolidate. And Gold tests key breakout level.
Tuesday's stock market rally helped to add some conviction to...
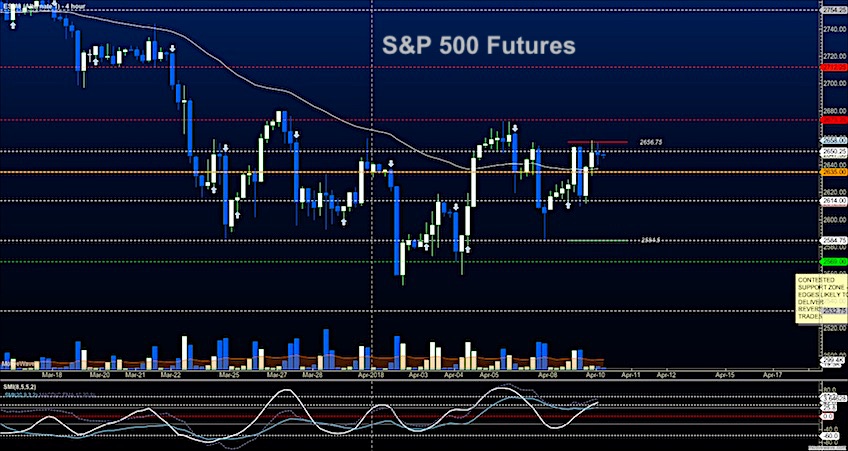
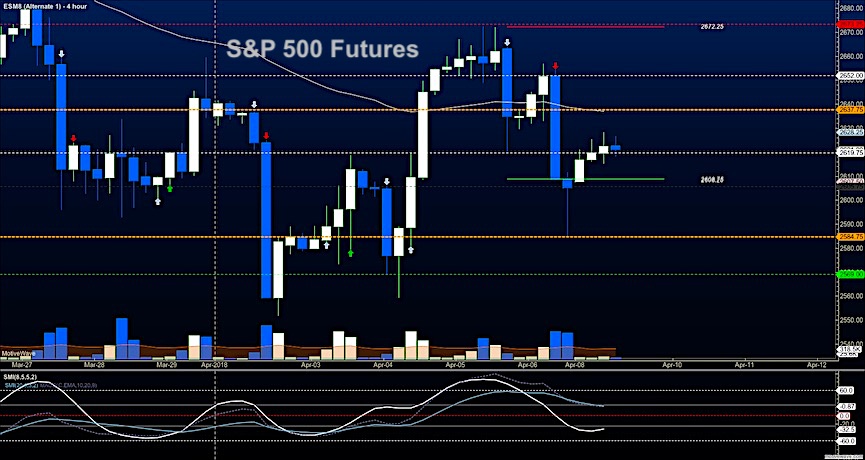
S&P 500 Futures Trading Update: Bulls Try Again
Broad Stock Market Futures Outlook for April 10, 2018
Traders continue to see big swings in the stock market. Yesterday's reversal lower has been reversed higher...
S&P 500 Futures Trading Outlook: Playing The Edges
Broad Stock Market Outlook for April 9, 2018
An overnight relief bounce in stock market futures greets traders Monday morning. Even so, the S&P 500 and...
Here’s Why The Stock Market Is A Sloppy Mess
The bulls got caught looking higher this week...
While many investors have had high hopes about a successful retest of the February stock market lows,...
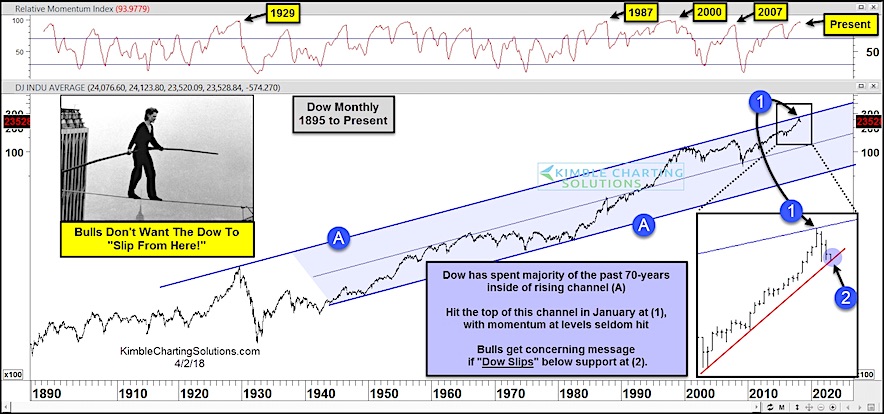
Stock Market Bulls Don’t Want The Dow To Slip From Here!
The Dow Jones Industrial Average peaked at 26,616 on January 26th.
Those highs set the stage for the stock market correction that investors are facing...
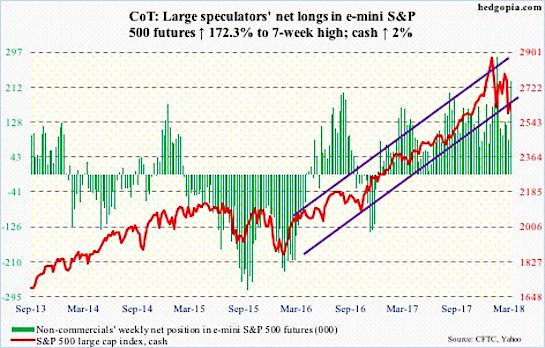
COT Report: Bulls Defend 200 Day MA and Get Longer
The following chart and data highlight non-commercial commodity futures trading positions as of March 27, 2017.
This data was released with the March 30 COT...
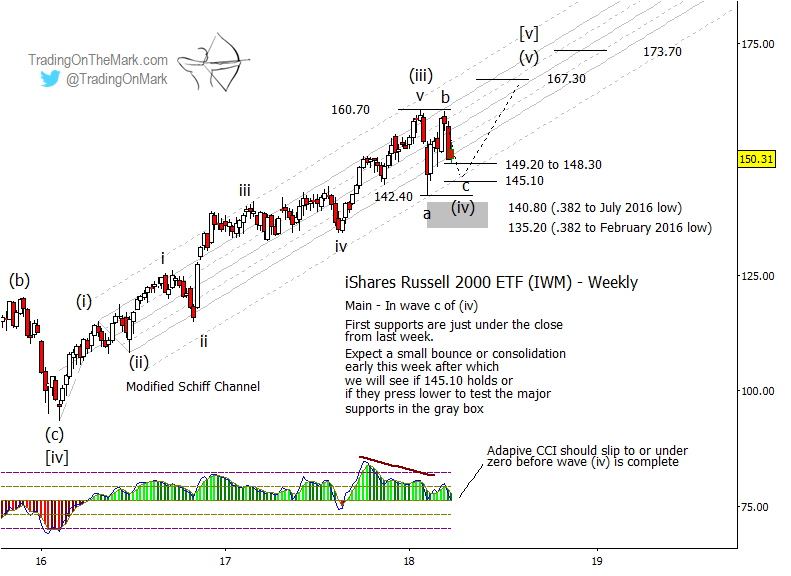
Russell 2000 Outlook: Bulls Should Be Back Soon
With vastly increased volatility and some precipitous down days, equity indices have been giving some investors heartburn. For the Elliott wave trader, that volatility...

