Broad Stock Market Futures Outlook for April 10, 2018
Traders continue to see big swings in the stock market. Yesterday’s reversal lower has been reversed higher this morning. Bullish traders are showing some force as we hold higher support after creating a short-term higher low.
We are moving upward into resistance with pullbacks being bought. Note, though, that the failure to hold higher lows will show the weakening of this near-term upside trend.
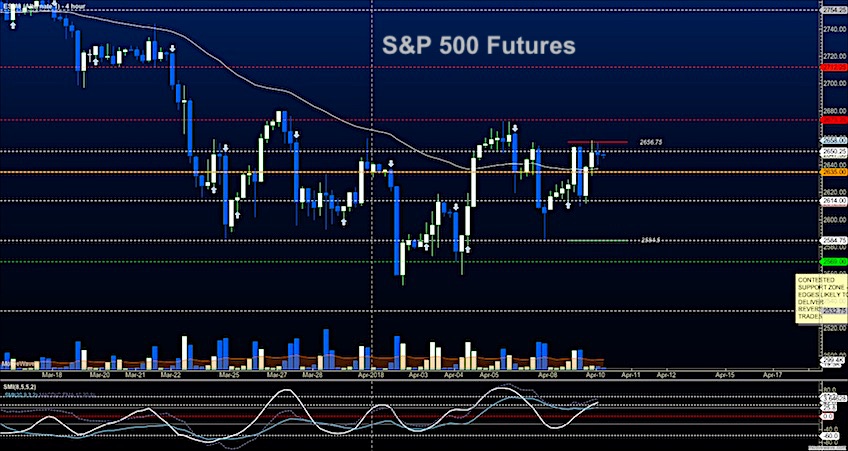
S&P 500 Futures
Stalled at 2651 for now as we struggle to breach this known area of contention. We now have positive drift as we watch support hold higher to stay on the long side of the trade. Sellers are poised but so far, bullish action shows today. The line in the sand to shift the balance intraday seems to be near 2635, as it was yesterday. The bullets below represent the likely shift of trading momentum at the positive or failed retests at the levels noted.
- Buying pressure intraday will likely strengthen with a bullish retest of 2652.75
- Selling pressure intraday will likely strengthen with a bearish retest of 2634.50
- Resistance sits near 2651.75 to 2667.5, with 2674.25 and 2684.75 above that.
- Support sits between 2639.25 and 2627.5, with 2606.5 and 2597.50
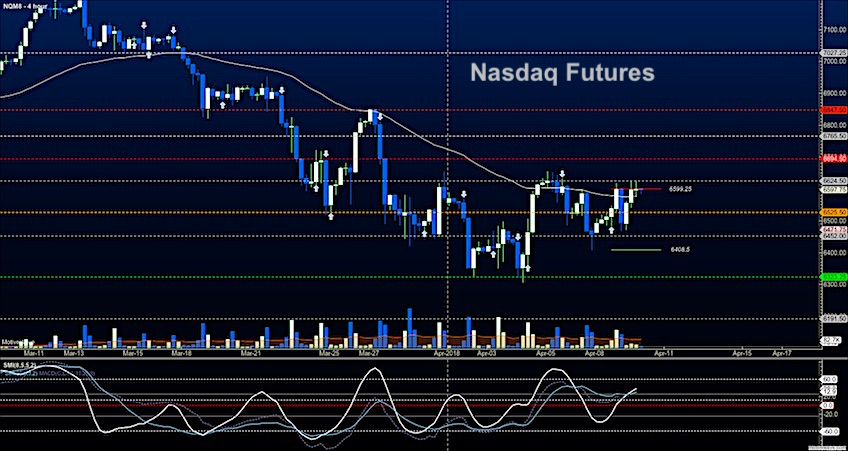
NASDAQ Futures
Another day begins with topping, BUT with steeper momentum and recovery on the mind of traders, we could easily breach these resistance levels. Pullbacks are buying zones as long as we hold 6548. The chart is quite messy between 6574 and 6604. The bullets below represent the likely shift of intraday trading momentum at the positive or failed tests at the levels noted.
- Buying pressure intraday will likely strengthen with a bullish retest of 6612.75
- Selling pressure intraday will likely strengthen with a bearish retest of 6572.50
- Resistance sits near 6607.5 to 6626.5 with 6652.5 and 6727.25 above that.
- Support sits between 6584.5 and 6554.5, with 6525.25 and 6414.75 below that.
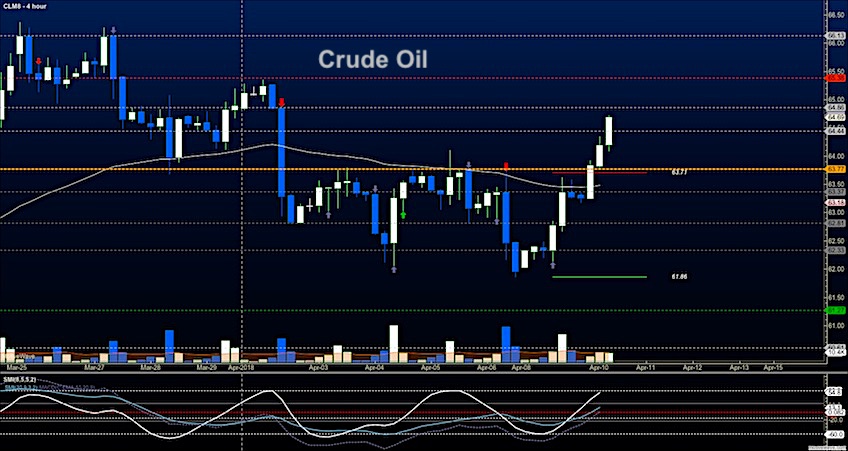
WTI Crude Oil
Oil held its lows and rocketed higher, now with 64.9 as near resistance this morning. Pullbacks will present buying pressure here as we move into the API and EIA over the next two days. The bullets below represent the likely shift of intraday trading momentum at the positive or failed tests at the levels noted.
- Buying pressure intraday will likely strengthen with a bullish retest of 64.90
- Selling pressure intraday will strengthen with a bearish retest of 64.10
- Resistance sits near 64.82 to 65.23, with 65.52 and 66.8 above that.
- Support holds near 64.45 to 64.13, with 63.73 and 63.23 below that.
Twitter: @AnneMarieTrades
The author trades stock market futures every day and may have a position in mentioned securities at the time of publication. Any opinions expressed herein are solely those of the author, and do not in any way represent the views or opinions of any other person or entity.


 Ready To Break Out?")


")