I’m often asked whether I’m bullish or bearish on a certain market.
I always like to remind people that the market can go in three directions, listed in order from least painful to most painful: up, down, and sideways.
You would think a down market would be the most painful, but you would be wrong. At least a down market has a sense of direction, a sense of control.
In fact, one of the behavioral biases that I’ve often seen in the financial industry is the “illusion of control” bias. That is, we feel as if we have the ability to will the market to do certain things, often in line with our market outlook.
When the market goes sideways, it frustrates pretty much everyone. Bulls and bears are all left to wait, impatiently, for something meaningful to happen.
Back in mid-February, I wrote about the S&P 500 and mentioned that “a sideways tape is possible for days or even weeks.” Apparently I should have added “or even months” to the end of that sentence!
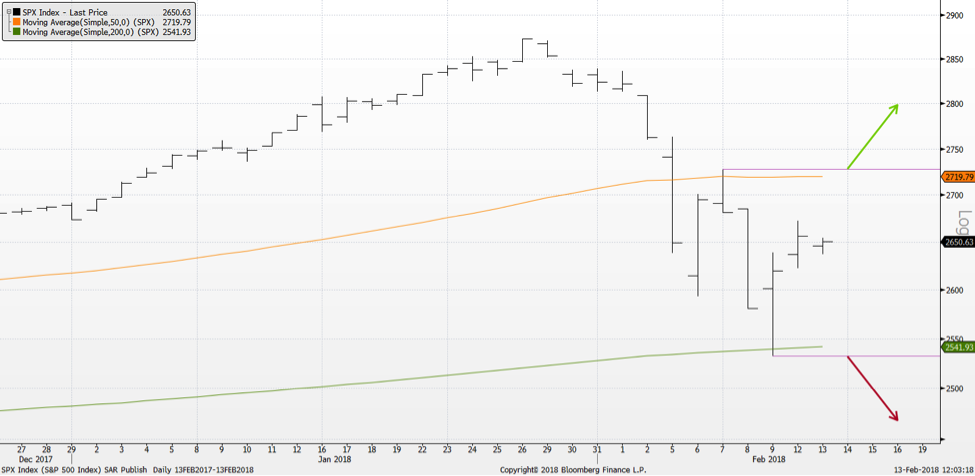
Below is the chart we discussed in February, showing the newly established trading range with clear support and resistance levels. My assessment was to follow a confirmed breakout through either level, as that would demonstrate the direction of momentum going forward.
Here is an updated chart, showing a series of failed attempts to break above the resistance level. We traded above the resistance line a number of times, and even closed higher on a couple of occasions. But each higher close was followed by distribution the next day in the form of a lower close or bearish engulfing pattern.
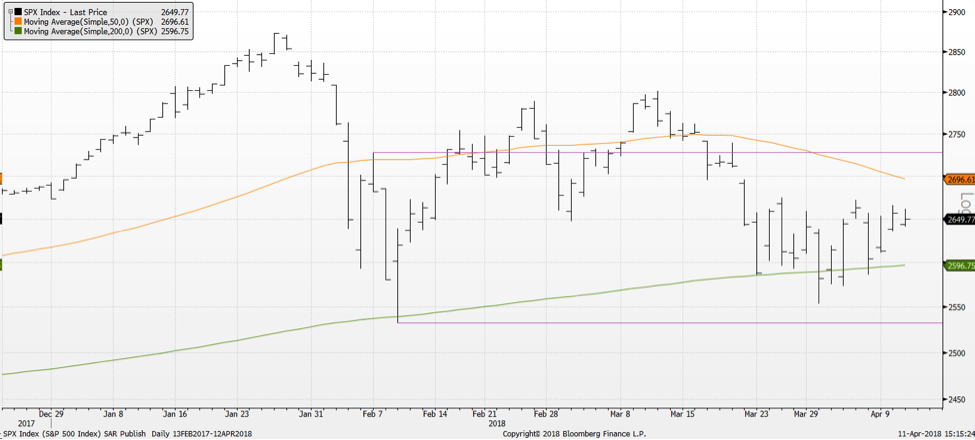
It’s also worth noting that in the almost two months since I wrote that first article, the S&P has returned to almost the exact same price level. We are once again in the middle of a range, set between the 50-day moving average and previous resistance above, and the 200-day moving average and previous support below.
The good news about sideways markets is they do not last forever. I would reiterate that the best course of action is to follow the momentum behind any break outside of the range.
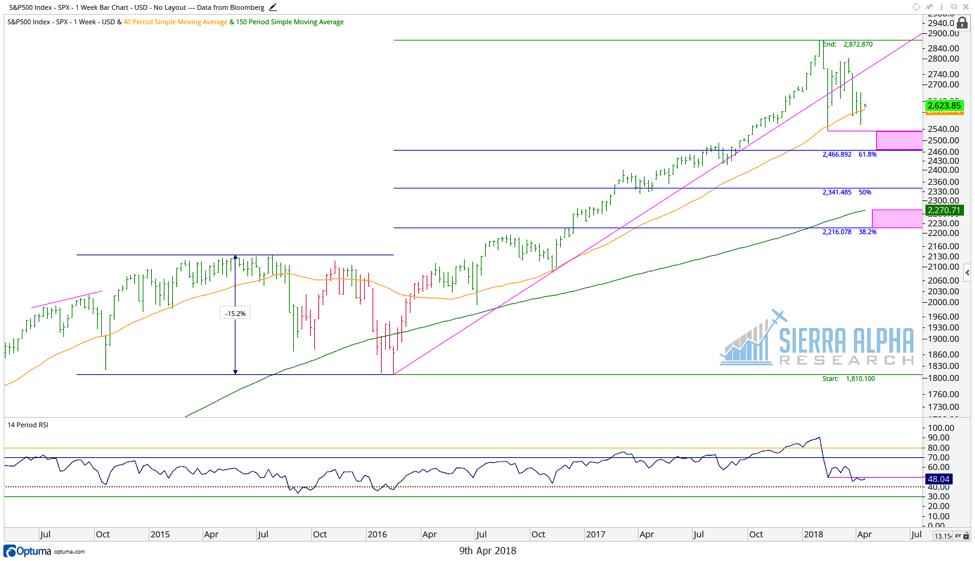
To the downside, a confirmed close below the 200-day moving average and then previous support around 2530 would clear the way to long-term support at 2460 and a potential downside objective in the 2220-2270 range.
To the upside, we would need to see a confirmed breakout above the previous resistance level in the 2750-2800 range. It’s also worth watching some key names like GOOGL to see how they trade around current levels. Alphabet is sitting on support not just at its 200-day moving average but also the ever important “big round number” of 1,000.
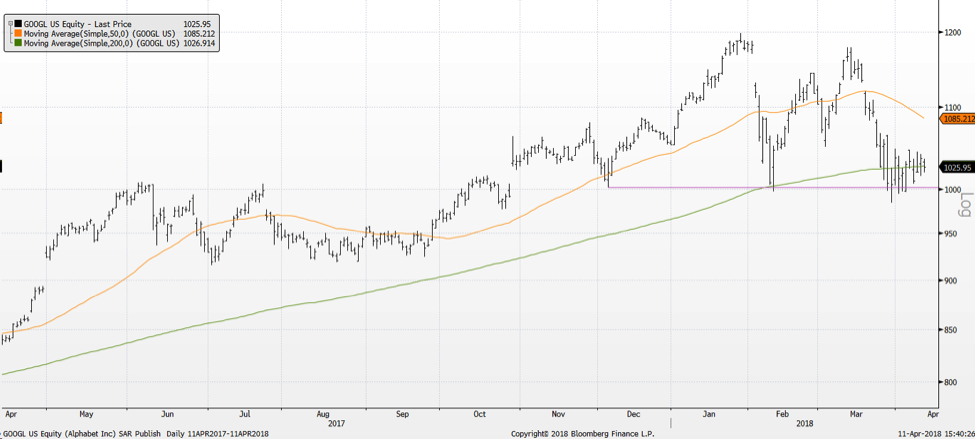
Until we see the S&P 500 meaningfully break above resistance, and stocks like GOOGL show signs of accumulation at these levels, I see the weight of the evidence as short-term bearish.
Note that you can gain deeper insights and more meaningful analysis from me over at Sierra Alpha Research. Thanks for reading.
RR#6,
Dave
Twitter: @DKellerCMT
The author does not have a position in mentioned securities at the time of publication. Any opinions expressed herein are solely those of the author, and do not in any way represent the views or opinions of any other person or entity.


: Showing Some Signs of Emerging Strength")
