Stocks have been see-sawing and whipping around the past couple weeks, but one thing remains…
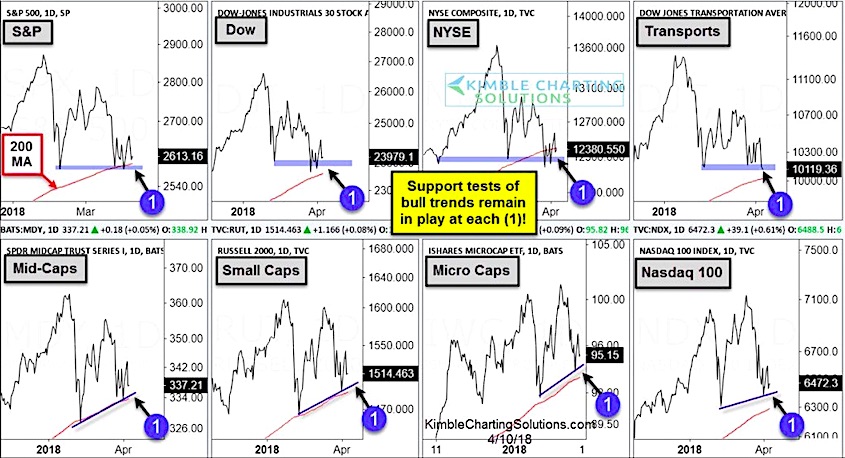
Stocks are holding on above key price support across several stock market indices… for now.
The chart below looks at 8 different stock market indices and where there respective price support levels currently lie.
The graphic includes S&P 500, Dow Jones Industrials, NYSE Composite, Dow Transports, Mid-Caps, Russell 2000, Micro Caps, and the Nasdaq 100.
While these support levels offer an area for price rallies to begin, they also show where the market could fail and trigger a mover lower.
If any sort of tradable rally is in the cards, bulls will need this level to hold. Stay tuned!
Note that KimbleCharting is offering a 30 day Free trial to See It Market readers. Just send me an email to services@kimblechartingsolutions.com for details to get set up.
Twitter: @KimbleCharting
Any opinions expressed herein are solely those of the author, and do not in any way represent the views or opinions of any other person or entity.


