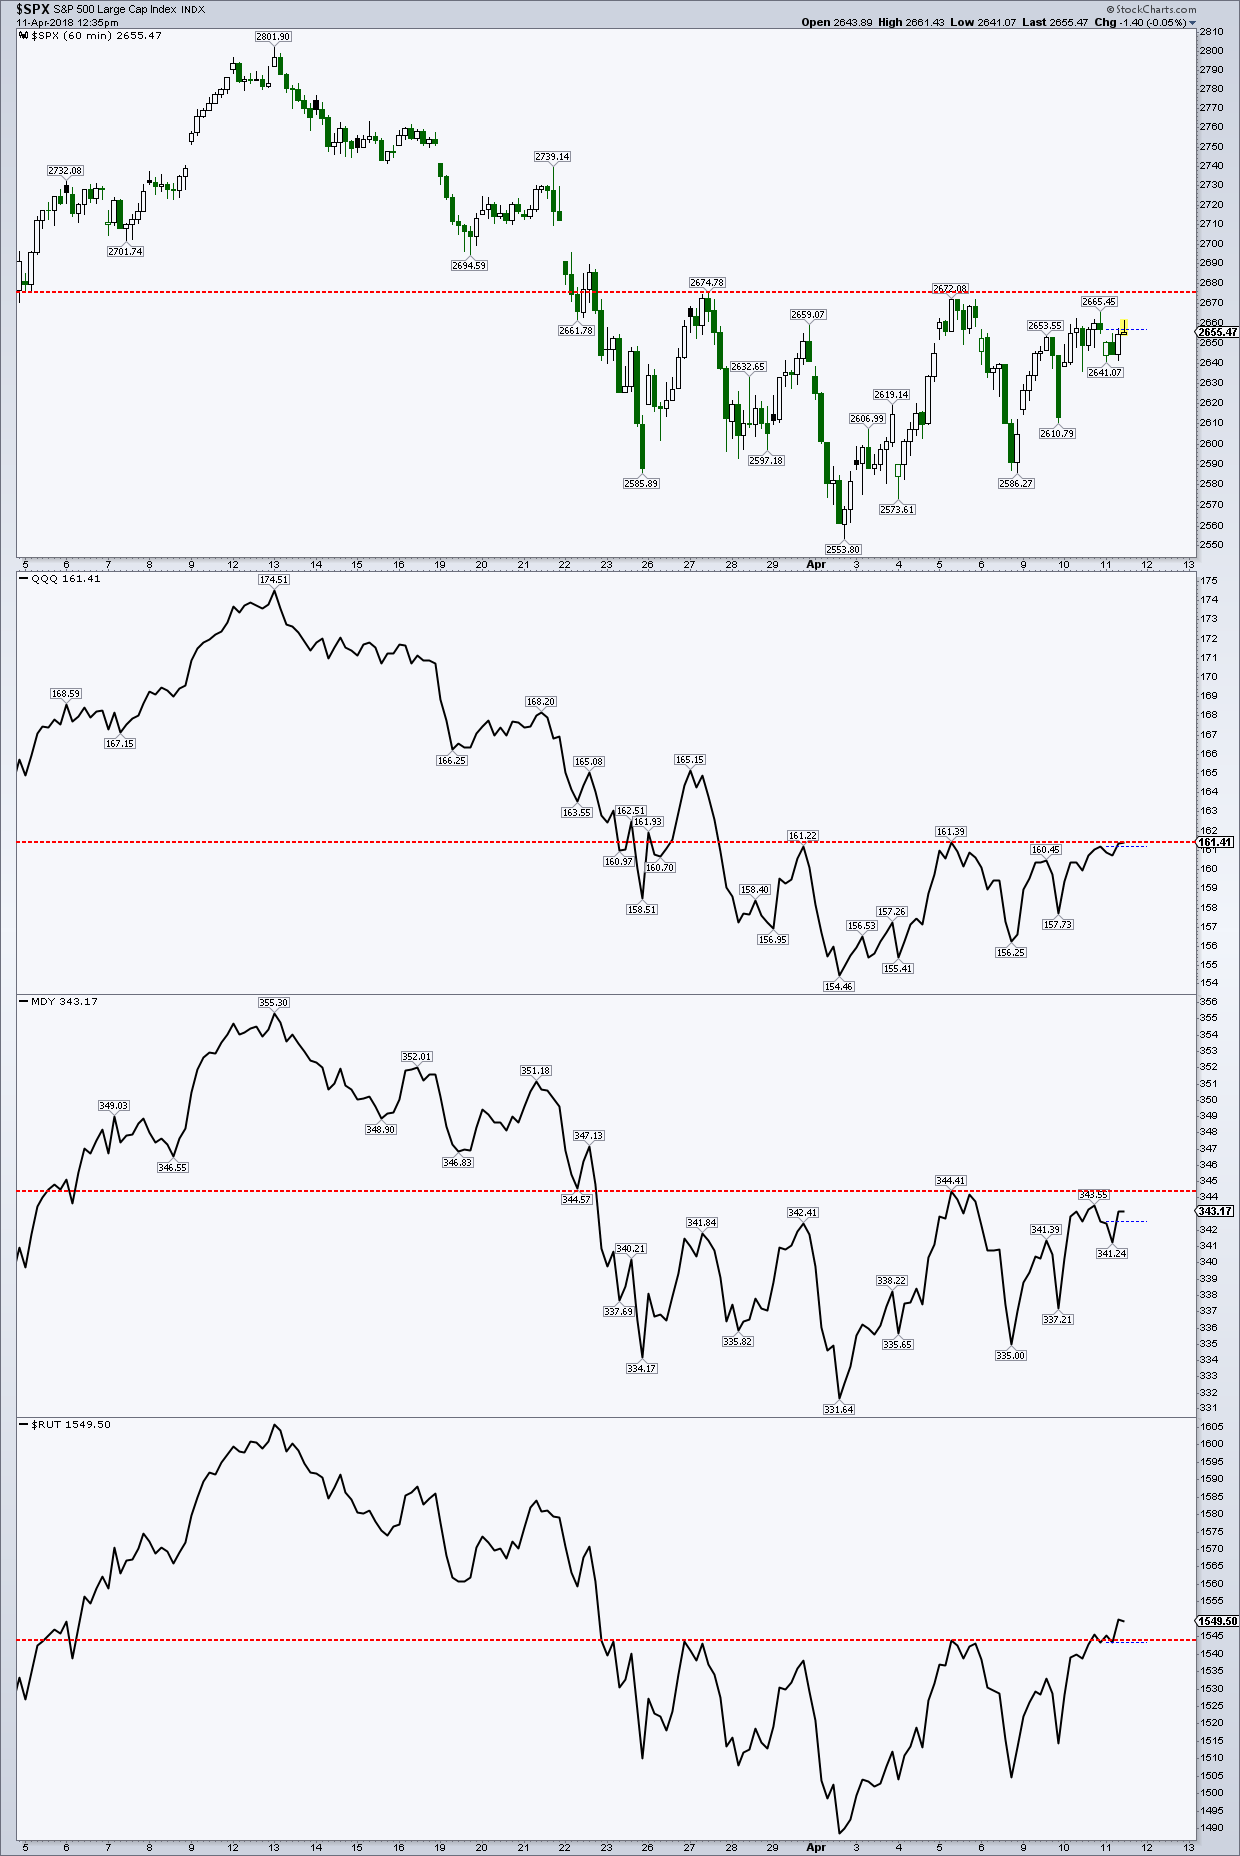
This is a 1-hour chart of the S&P 500, QQQ’s, Midcap’s (MDY), and Russell 2000 (RUT).
All of these key stock market indices are tracing out potential complex inverse head-and-shoulders (H&S) price patterns.
The Russell 2000 (RUT) has poked its head above the neckline while the others are right at or right below their respective necklines. These formations are bullish but need a breakout above the necklines for confirmation.
I will reiterate that if this turns out to be a larger double bottom (first bottom in February) it will not be a classic pattern where price quickly tests and reverse higher. Just last week, I shared why the stock market was a big mess. Lots of gyrations back and forth… ugh.
BUT, price is price and and good traders need to be aware (and open to) the potential for changing dynamics. Breakouts by all of these stock indices would be rather bullish in the short-term.
For instance, a measured move based on the size of the S&P 500’s inverse H&S targets up near the 2,800 region, almost a 5% move from the breakout area of 2,674.
Anecdotally, it does seem like a lot of people are looking for another washout to new lows, and therefore, either still short or under invested. In addition, we have had a lot of bad news of late, and the market just continues to shrug everything off. Ignoring bad news is almost always bullish.
Feel free to reach out to me at arbetermark@gmail.com for inquiries about my newsletter “On The Mark”. Thanks for reading.
Twitter: @MarkArbeter
The author may have a position in mentioned securities at the time of publication. Any opinions expressed herein are solely those of the author, and do not in any way represent the views or opinions of any other person or entity.


