The following chart and data highlight non-commercial commodity futures trading positions as of March 27, 2017.
This data was released with the March 30 COT Report (Commitment of Traders). Note that these charts also appeared on my blog.
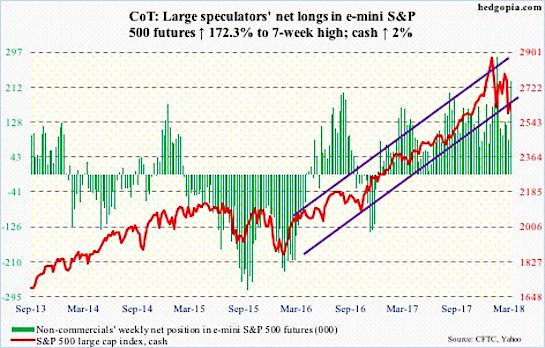
The chart below looks at non-commercial futures trading positions for the S&P 500. For the week, the S&P 500 traded higher by +2.0%.
S&P 500 Futures
March 30 COT Report Spec positioning: Currently net long 226.8k, up 143.5k.
This week’s round goes to the bulls. Not only did they not lose the 200-day on the cash (2640.87) but also managed to post higher lows versus the low on February 9. Resistance lies at shorter-term moving averages, as well as the 50-day (2729.72). The path of least resistance is up near term.
On Friday last week, 15.6 percent of S&P 500 stocks were above the 50-day, slightly higher than the prior low of 13.6 percent On February 8. By Thursday this week, the metric had risen to 31.6 percent, and has room to rise.
The bulls need to see flows improve. In the week to Wednesday, there were outflows everywhere.
SPDR S&P 500 ETF (SPY) lost $5.3 billion, Vanguard S&P 500 ETF (VOO) $1.4 billion and iShares core S&P 500 ETF (IVV) $4.6 billion (courtesy of ETF.com).
In the same week, U.S.-based equity funds (including ETFs) lost $14.4 billion (courtesy of Lipper.com).
Twitter: @hedgopia
Author may hold a position in mentioned securities at the time of publication. Any opinions expressed herein are solely those of the author, and do not in any way represent the views or opinions of any other person or entity.


