The Dow Jones Industrial Average peaked at 26,616 on January 26th.
Those highs set the stage for the stock market correction that investors are facing right now.
How and Why?
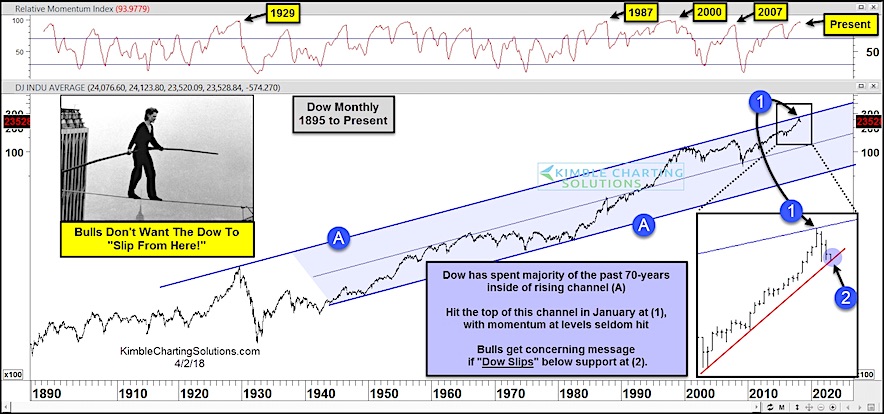
We’ve been warning since early this year that stocks were getting ahead of themselves. The chart below illustrates just how far ahead they got… the Dow’s momentum reading this year reached levels not seen since 1929, 1987, 2000, and 2007. At the same time, the Dow’s price reached the top side (point 1) of a 70 year rising channel (point A).
Decision Point
The stock market correction has taken the Dow Jones down to an important intermediate-term support – its rising “monthly” trend line off the 2016 lows (point 2). What happens here could determine whether this is a “run of the mill” correction or something more ominous.
Any puncture of support would need to be short-lived for the intermediate uptrend to remain in tact. However, if bulls fail to adequately defend this trend line, then the market decline could get ugly. Stay tuned!
Dow Jones Industrial Average Long-Term Chart
Note that KimbleCharting is offering a 30-day Free trial to See It Market readers. Just send me an email to services@kimblechartingsolutions.com for details to get set up.
Twitter: @KimbleCharting
Any opinions expressed herein are solely those of the author, and do not in any way represent the views or opinions of any other person or entity.
: Cup (and Maybe Handle) Watch")
 Trading Near Top Of Price Range")
 Reaches Important Price Support")