Back in December, we were featured in a MarketWatch article entitled “A Dow Crash? Another 25% Jump? No, Here’s The Case For A Market Freeze In 2018.“
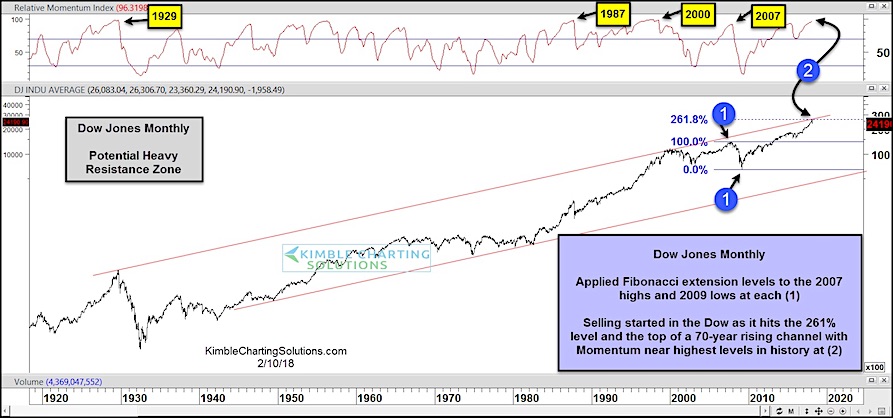
At that time, our research showed that the Dow Jones Industrial Average was fast approaching “major” dual resistance at the top of a 70 year resistance channel and 261 Fibonacci extension level.
Fast forward to today, and it’s pretty clear that the Dow Industrials are struggling to break through this resistance level. And the stock market has stalled out.
The past several days have been extremely volatile, with the Dow Jones Industrial Average falling over 1000 points in 2 of the past 5 trading sessions.
The “monthly” chart below is an updated version of the chart featured in the MarketWatch article. Note that market momentum is near its highest levels ever… comparable to 1929, 1987, 2000, and 2007.
That should be enough to keep investors honest here. But will these headwinds lead to a broader “market freeze”? Stay tuned!
Note that KimbleCharting is offering a 30 day Free trial to See It Market readers. Just send me an email to services@kimblechartingsolutions.com for details to get set up.
Twitter: @KimbleCharting
Any opinions expressed herein are solely those of the author, and do not in any way represent the views or opinions of any other person or entity.


 Flirting With Critical Support… Again")


