
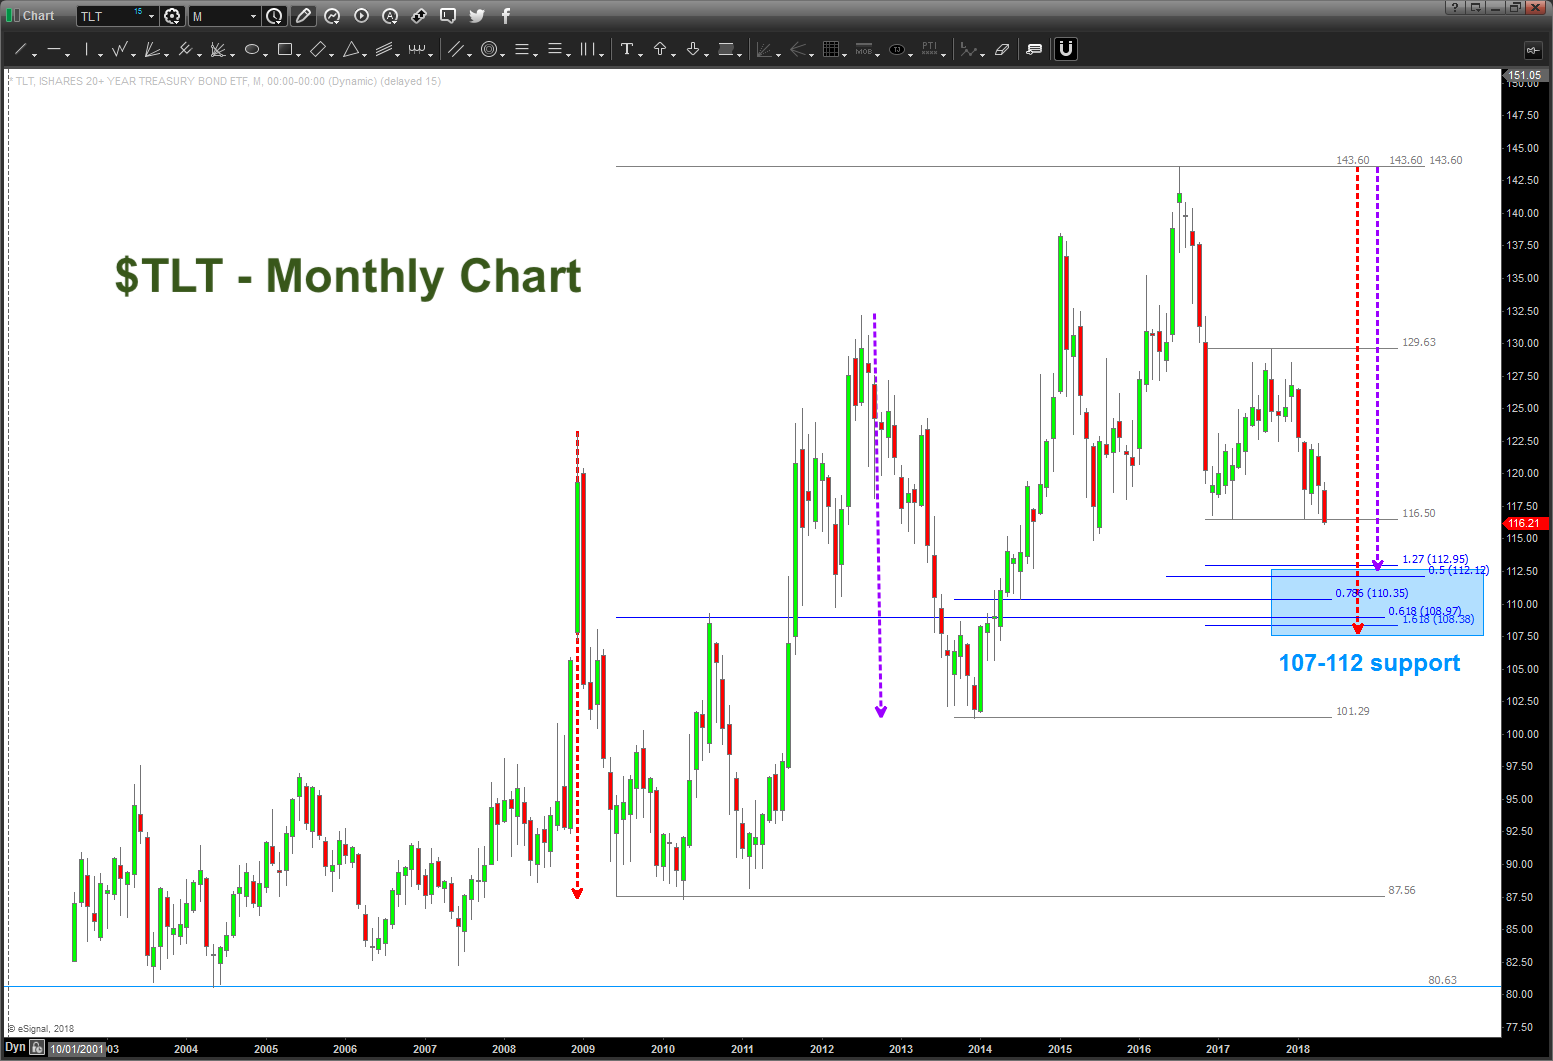
Treasury Bonds Top Heavy, But Sliding Into Support Area
Almost two years ago, we focused on a measured move target and the 145 area as potentially strong resistance and topping points for Treasury...
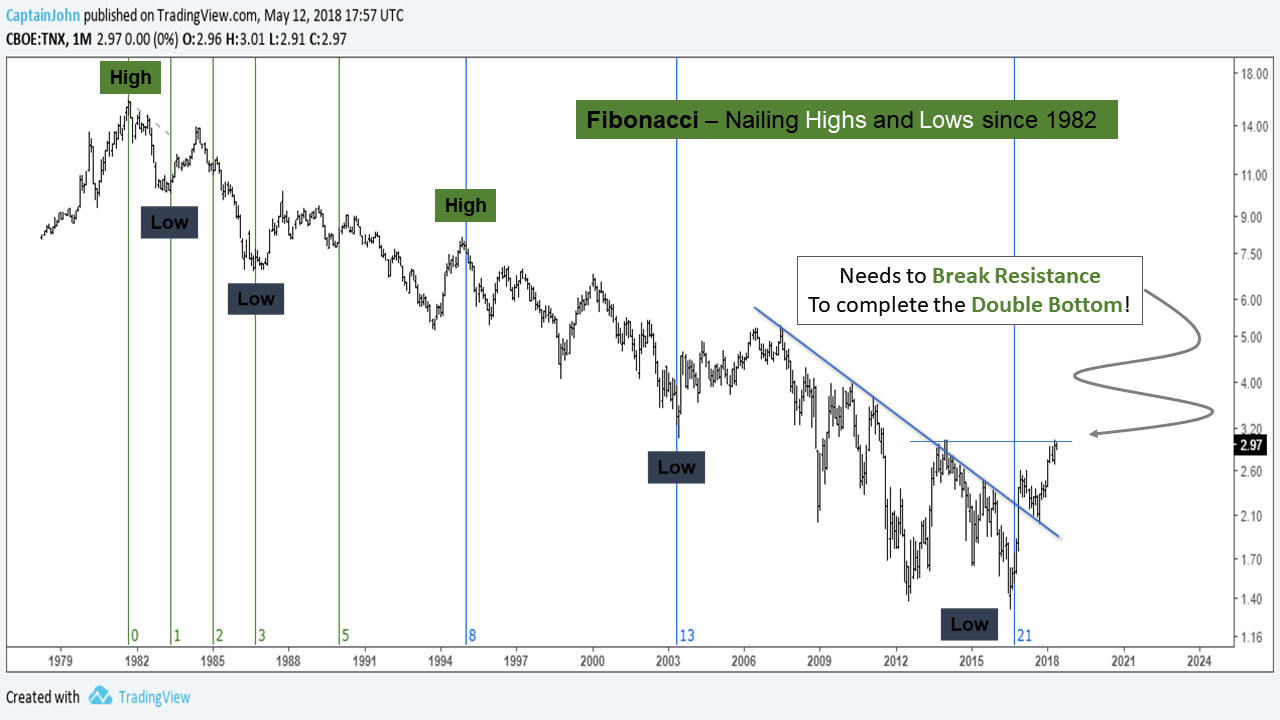
10 Year Treasury Yield Long-Term Outlook: Charts Point Higher
The 10 Year US Treasury Yield is getting the attention of investors here around 3 percent.
Well, it looks to be headed higher yet in...
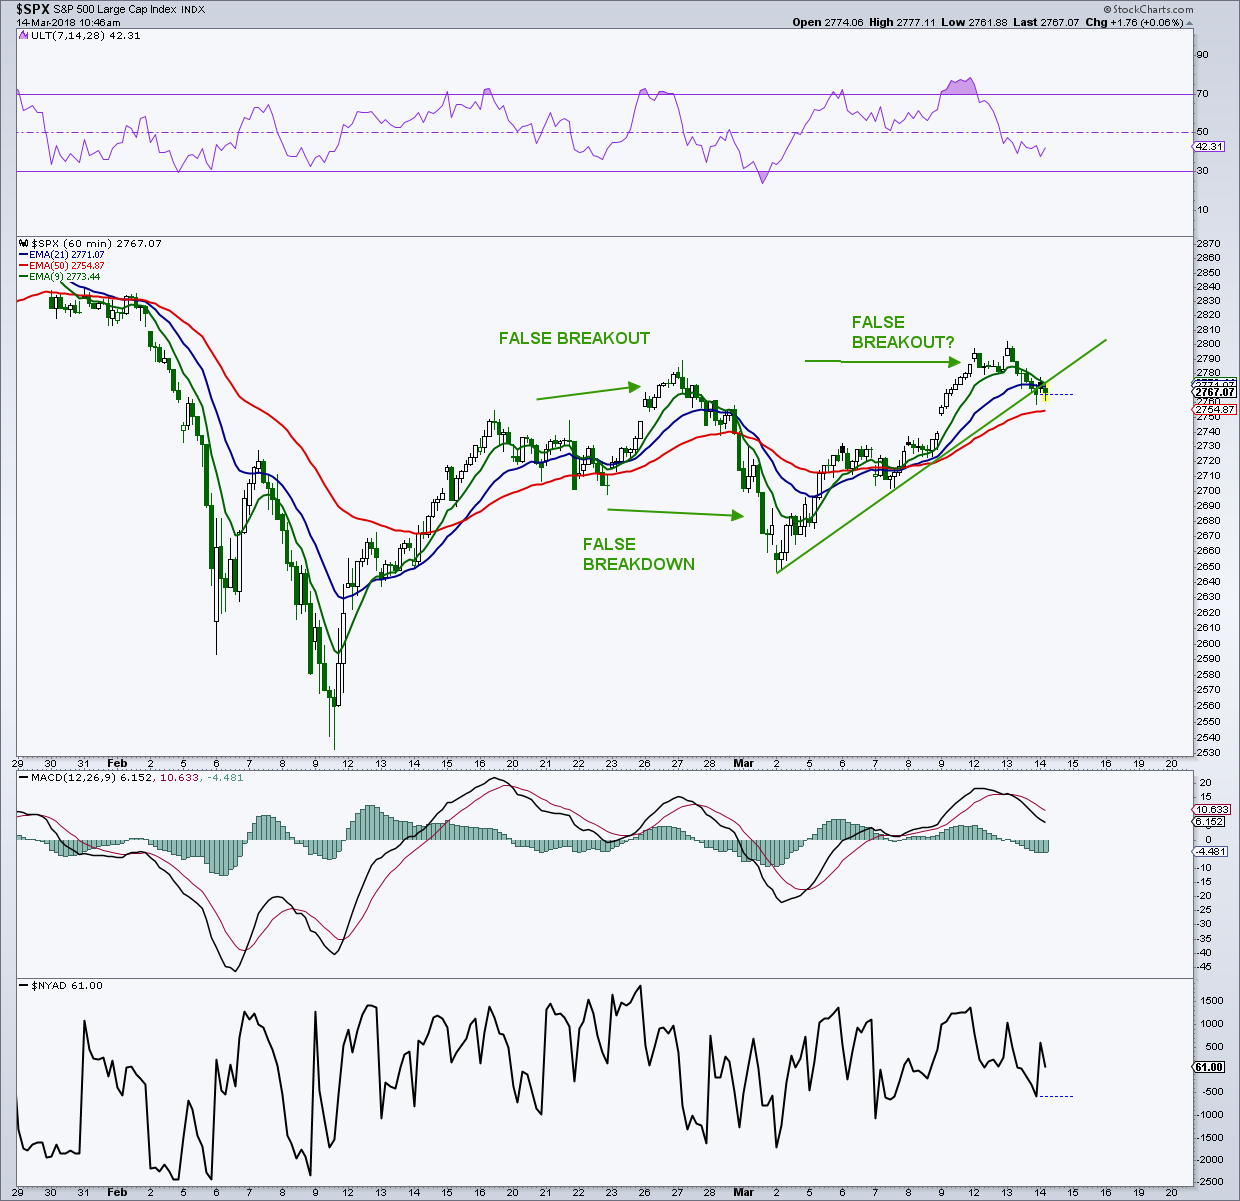
S&P 500 Technical Trading Outlook: False Moves
Like I have been saying in recent editions of my "On The Mark" newsletter, there will likely be a lot of false breakouts and...
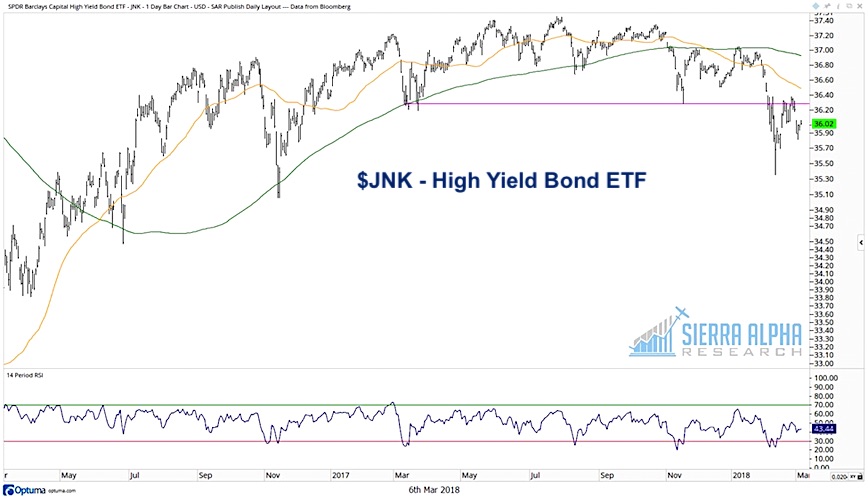
Slippery Signs Coming from the Junk Bond Market
High yield bonds can often serve as a leading indicator for the equity markets. And although indexes which track high yield returns have not...
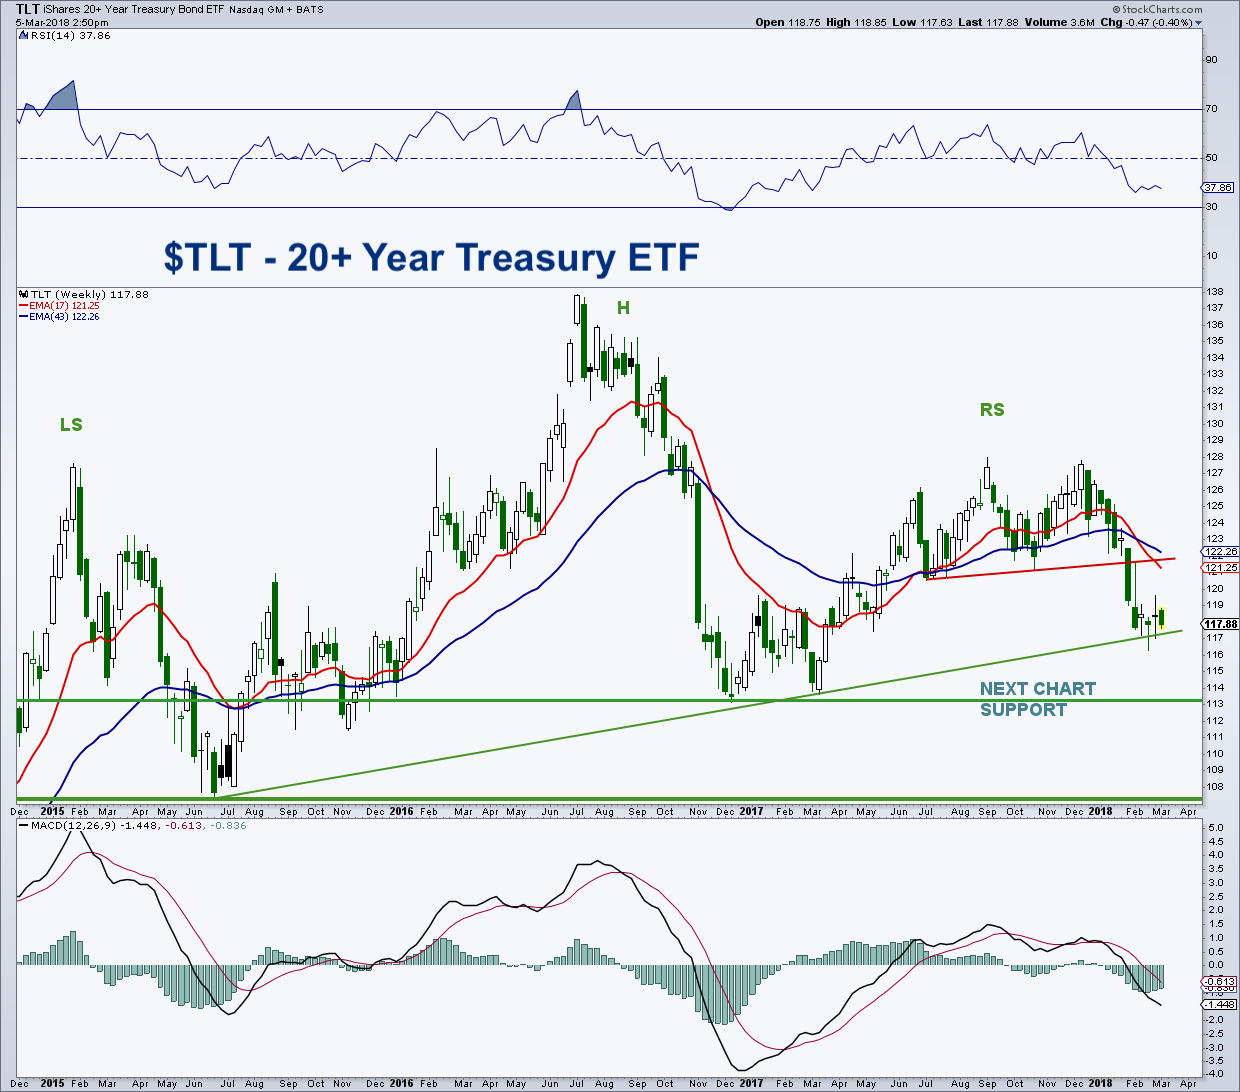
Treasury Bonds ETF (TLT): Near-Term Bounce, Long-Term Top?
Treasury bonds have gotten out of favor as investors continue to price in rising interest rates. This has the Treasury Bonds ETF (TLT) testing key...
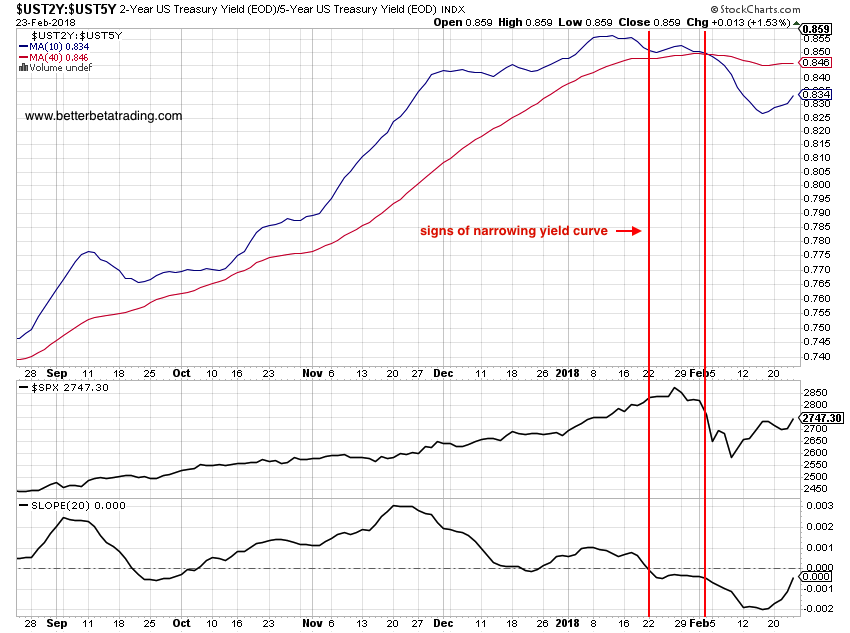
How To Use The Yield Curve As An Equities Risk On/Off Indicator
The drop in equity markets and subsequent V-shaped rebound has left many traders wondering: "Is it safe to increase long equity exposure?"
With pundits on...
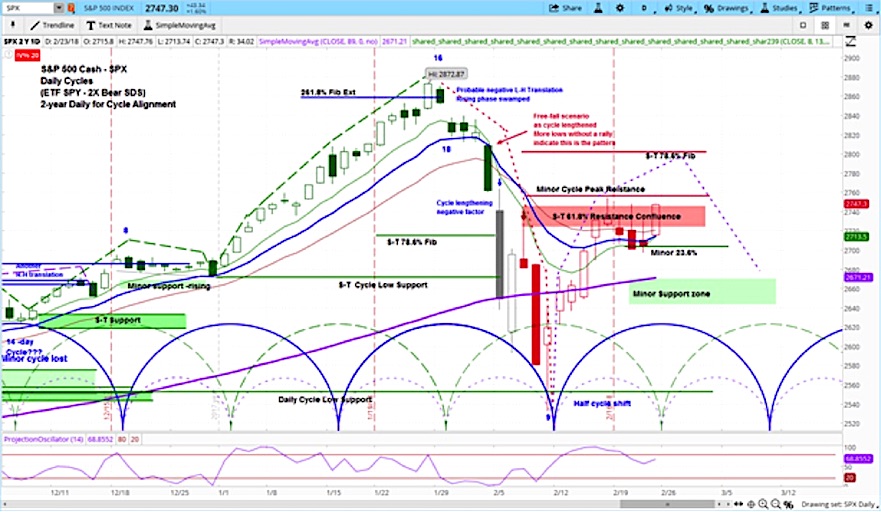
Market Outlook: Stocks Set To Continue Bounce, Then Fail
The S&P 500 reversed course on Friday and rallied back to new 3-week closing highs.
Look for stocks to extend gains into this week before...
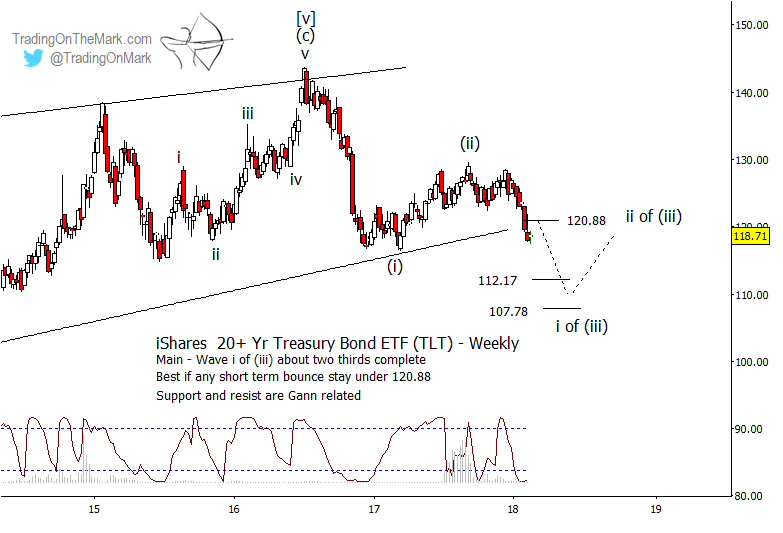
Riding The Downward Trend In US Treasuries
Our Elliott wave forecast for treasury bonds continues to hold up well. In June 2017 we described the minor rally during the first part...
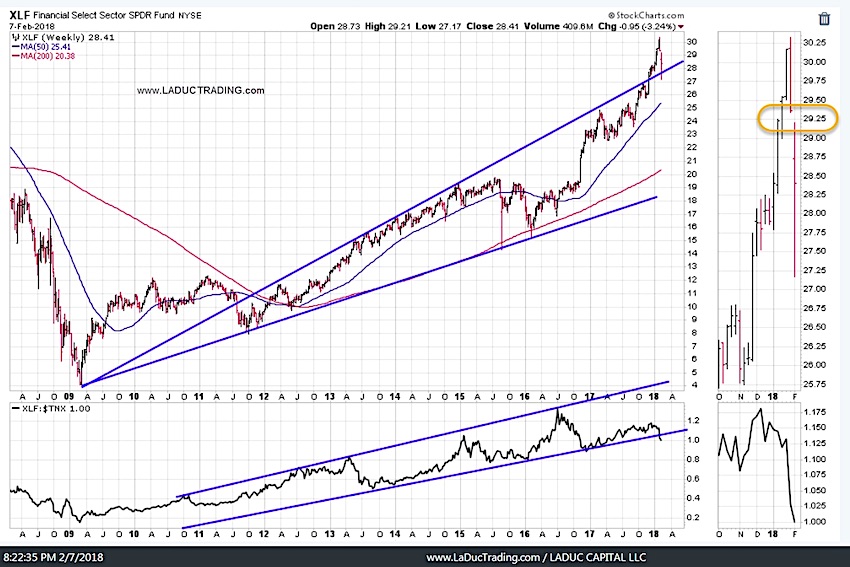
Intermarket Chart Attack: Not Done (Part 2)
This is an Intermarket Analysis chart review that I provided to my fishing club members Wednesday to prepare for the stock market downdraft I expect to continue.
These...
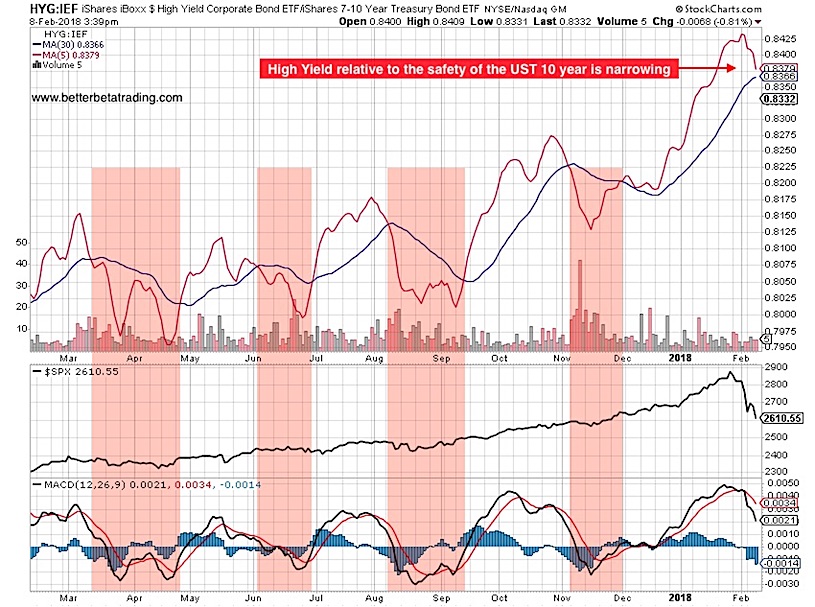
Bond Yield Spreads Don’t Bode Well For Equities
With the recent equity market turmoil, many traders and investors are looking for signposts. Is the sell-off contained to equities and VIX-related ETPs or...