Treasury bonds have gotten out of favor as investors continue to price in rising interest rates. This has the Treasury Bonds ETF (TLT) testing key price support in what could lead to a bounce near-term.
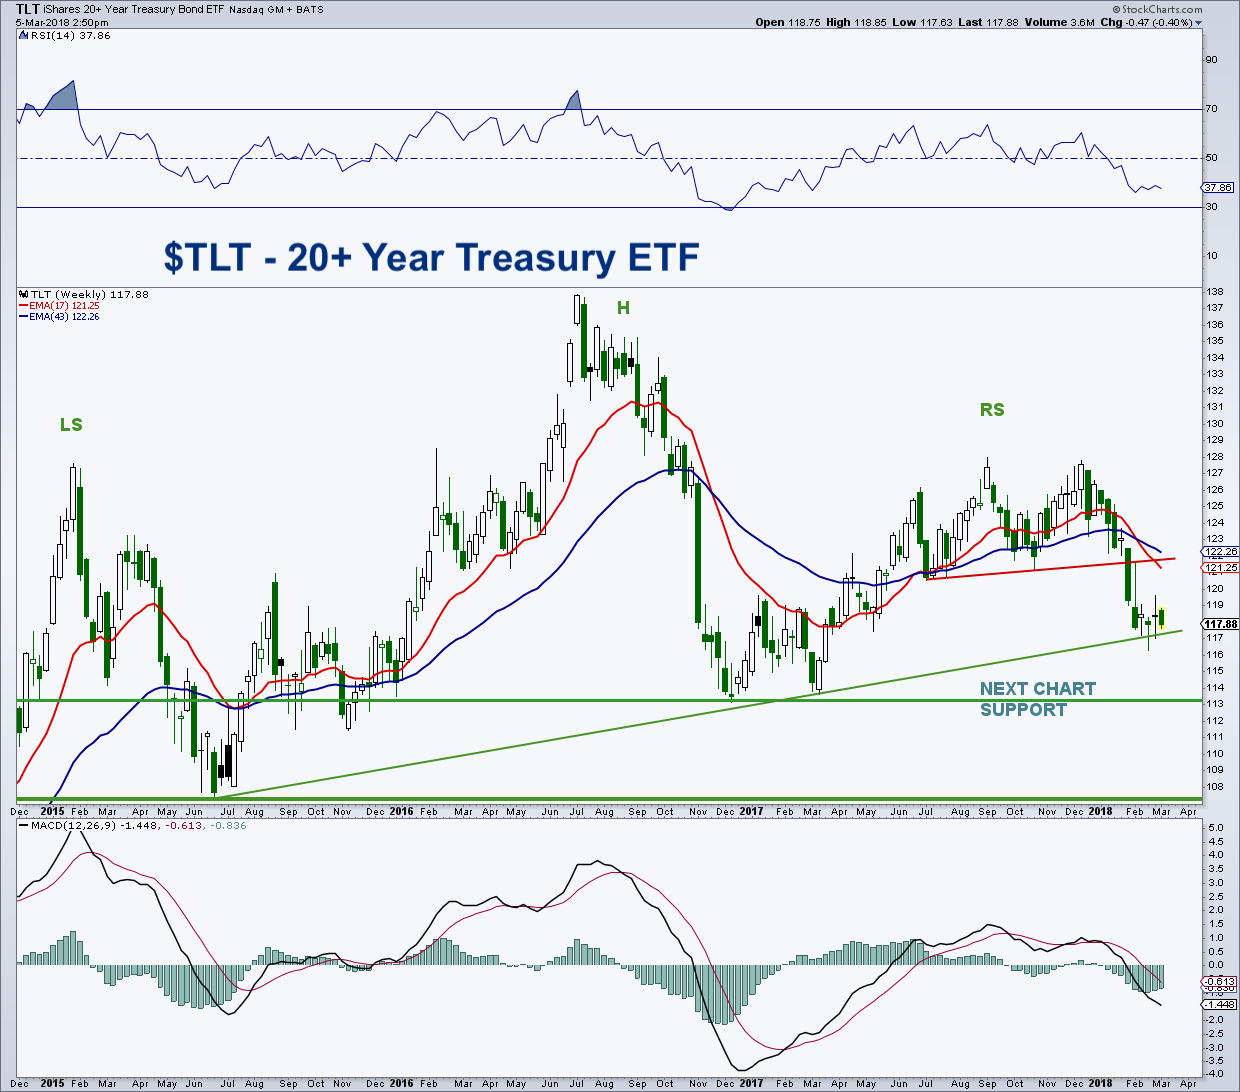
But the broader theme also shows up over the past few years in a potential longer-term head and shoulders topping pattern. See the weekly bar chart below.
Price/Technicals: Based on the size mini right shoulder (RS) top, we could see a measured move down to the 114 zone which just happens to be the last major low from late 2016/early 2017.
Longer term, it’s possible that the right shoulder is part of a bond market that is tracing out a massive head and shoulders top.
In the near term, we could see a counter trend rally as we are right at trendline support.
Bond Market Indicators: The COT data and market sentiment for the 10 and 30-year treasury has turned bullish, another reason to expect a rally. On a yield basis, the 10-year yield (2.86%) still needs to break above 3.04% to complete a double bottom and then go above 3.1%/3.2% to confirm that the 30+ year bull market in bonds is over. I am long the treasury market, and looking for a counter trend rally.
$TLT – 20+ Year Treasury Bond ETF (weekly chart)
Feel free to reach out to me at arbetermark@gmail.com for inquiries about my newsletter “On The Mark”. Thanks for reading.
Twitter: @MarkArbeter
The author does not have a position in mentioned securities at the time of publication. Any opinions expressed herein are solely those of the author, and do not in any way represent the views or opinions of any other person or entity.


: Showing Some Signs of Emerging Strength")
