Our Elliott wave forecast for treasury bonds continues to hold up well. In June 2017 we described the minor rally during the first part of that year as probably a correction within a new downward trend.
Here we chart the two most prominent Elliott wave scenarios for the iShares 20+ Year Treasury Bond ETF (NYSE Arca: TLT) in light of that overall bearish view.
If your trading benefits from market analysis that focuses on the high-probability areas for turns, visit our website for more and check out the special February subscription offer that’s described at the end of this post.
Treating the 2016 high in bonds and TLT as a long-term top, we now expect price to move generally downward in a sizable correction that should span multiple years – possibly the greater part of a decade. However from a trader’s perspective, the most attractive moves in the near term may have an impulsive nature within the larger corrective pattern.
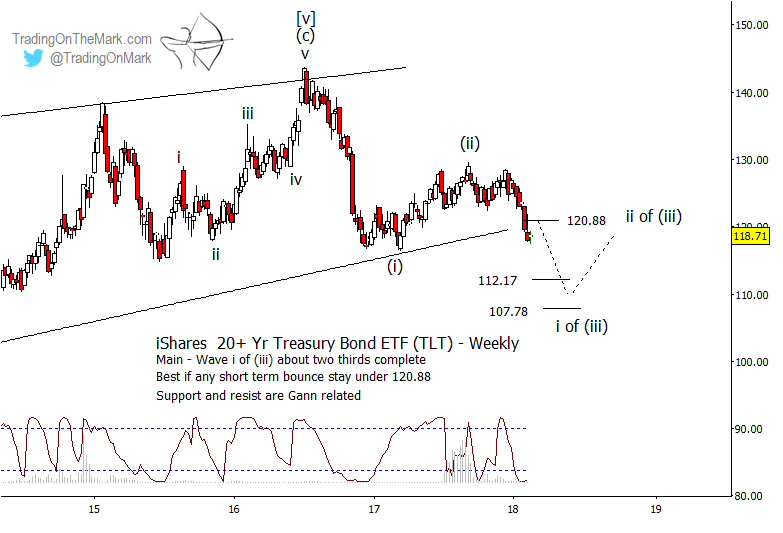
Both of the weekly charts included below show the rapid decline from the 2016 high to the early 2017 low as an impulsive sub-wave (i) of what should become a larger downward impulsive wave. We believe the subsequent bounce was the corresponding wave (ii), but it might have been merely the first part of (ii).
Our main scenario calls for TLT to continue pushing downward in the first stages of a strong wave (iii). This scenario would appear even more favorable if price were to make a rapid thrust farther beneath the trend line that originated in 2011 and acted as support twice since 2013. In the most bearish outcome, the Gann-related level at 120.88 would hold as resistance if tested.
Near-term targets for continued decline in this primary scenario include other Gann-related levels at 112.17 and 107.78, and those might represent good areas to manage any short positions.
It’s worth monitoring a less immediately bearish scenario, which envisions the wave (ii) correction as being still incomplete. If that were the case, we would not expect TLT to move very far downward in the near term. Likely areas for the middle wave ‘b’ of (ii) to find support include Fibonacci extensions at 117.08 and 114.36. A strong bounce from near one of those areas would lead us to consider that price was ready to move upward for a few months in sub-wave ‘c’ of (ii), all within a larger downward trend.
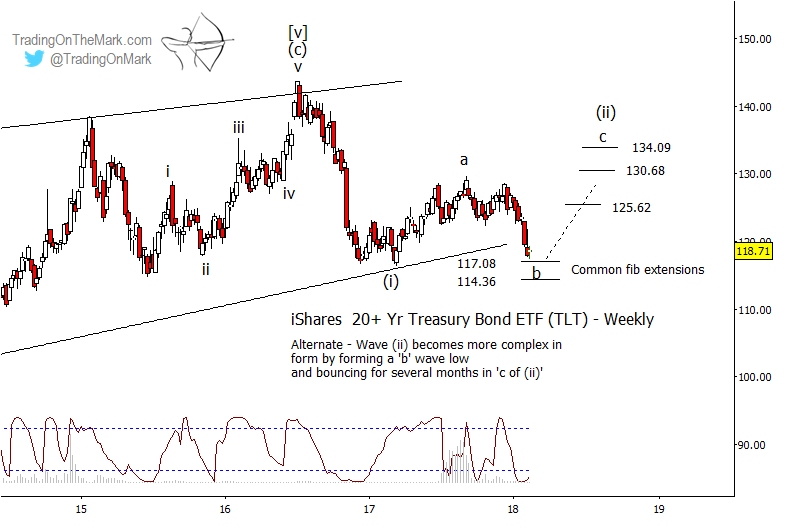
In this alternate scenario, provisional Fibonacci extension targets for upward wave ‘c’ would include 125.62, 130.68 and 134.09. If a strong bounce materializes, we will calibrate those targets more precisely based on measurements from eventual support.
The first signal that the alternate scenario might be working would be a weekly close above the Gann-related resistance mentioned earlier at 120.88.
You can see how this kind of technical analysis works on all time frames – weekly, daily and even intraday — by checking out our special offer for new subscribers. Just start a Daily Analysis subscription during February and we’ll give you access to our intraday trading room for three full weeks as a bonus. It’s a great way to see how we approach the trades on a faster time frame, especially with equity indices.
Twitter: @TradingOnMark
No position in any of the mentioned securities at the time of publication. Any opinions expressed herein are solely those of the author, and do not in any way represent the views or opinions of any other person or entity.


: Showing Some Signs of Emerging Strength")
