Almost two years ago, we focused on a measured move target and the 145 area as potentially strong resistance and topping points for Treasury Bonds and the ETF TLT.
You can read that post and retrace our analysis here: “TLT Price Target In View As Treasury Bonds Stretched”
Here’s an excerpt:
“…I showed how the price pattern had failed around the 134-135 level. And that failure gave way to a new chart pattern targeting 145. Note that TLT traded over 143 today. Fixed income is getting crazy…”
In that post, there are links to other articles discussing the fixed income market as it approached this price objective and topping area. Here’s the list for quick reference:
- $TLT Rally Could Extend To $145 This Summer
- Will The Fed Raise Rates: What Fed Funds Futures Are Saying
- Fed Funds Futures Smash Through Support
Over the past couple of days, I’ve noticed a lot of “chatter” about the interest rates. So I thought I’d provide a quick update.
The way I look at things, it makes me think a decline in rates (a counter trend decline) is imminent.
Two years ago, I was warning that Bonds had topped and I do think that it is a historical top. BUT I also think that bonds are getting very close to a bounce, which would result in a short-term decline in interest rates.
My downside targets come in around 107-112. Expect a bounce as we come into this price area.
The chart below highlights this primary support area for the TLT:
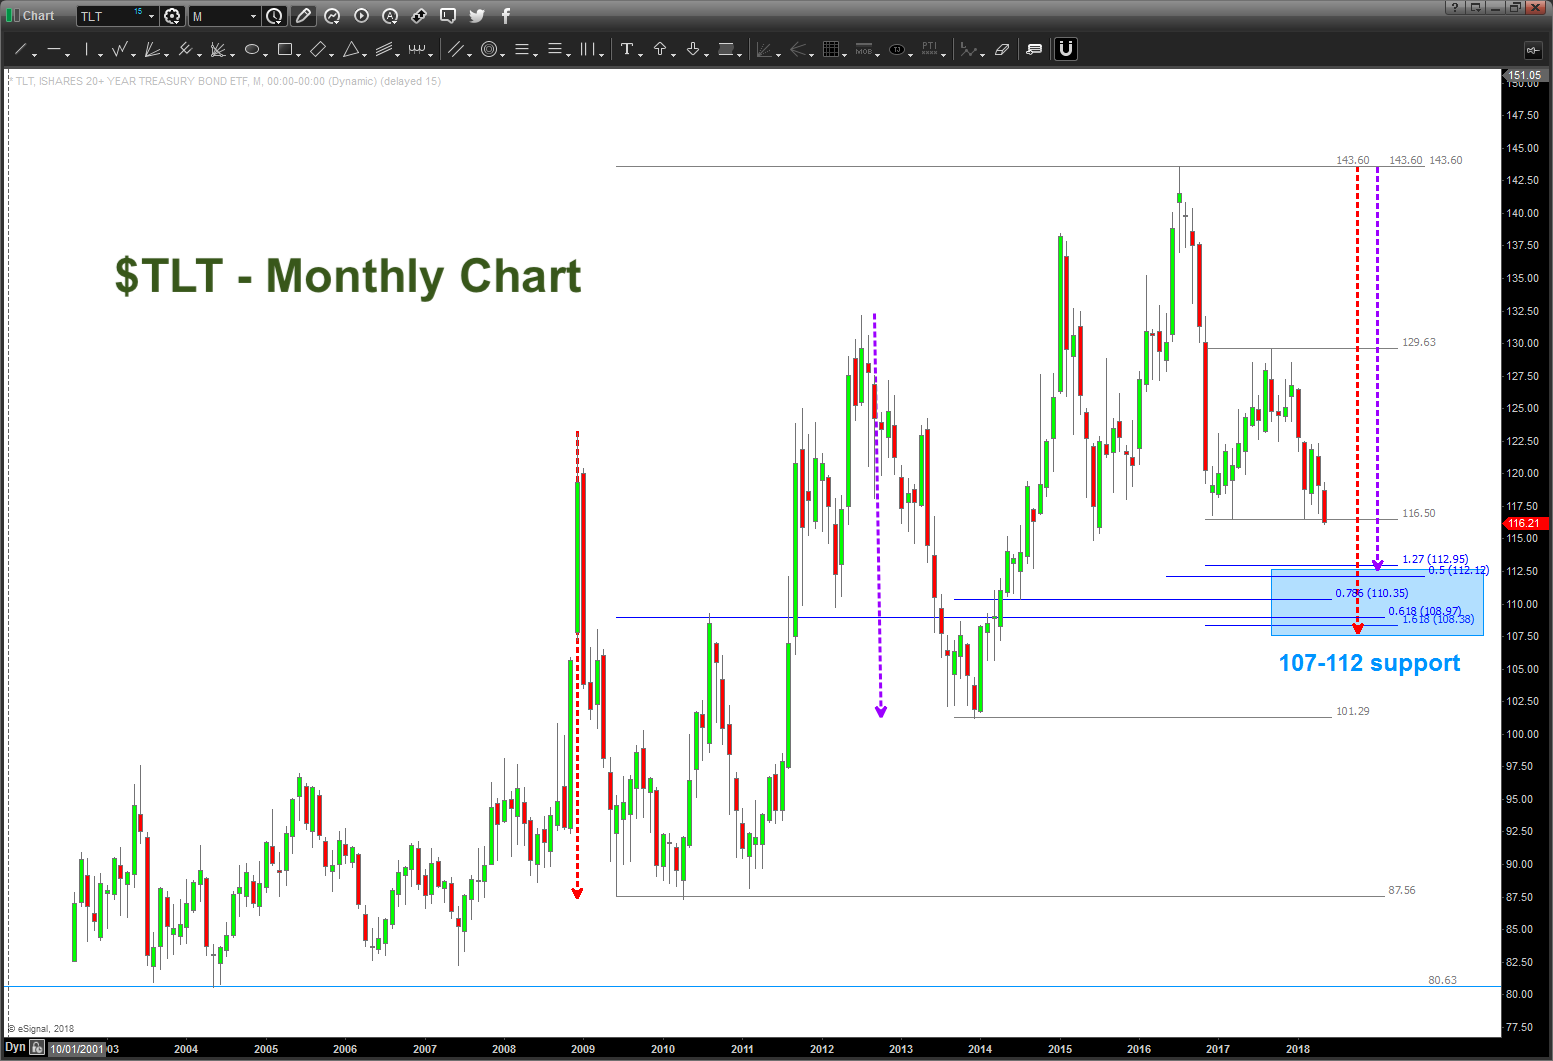
Overall, the thesis of a major top in bonds a couple years ago still appears to be correct… hold onto your hats folks, this is just getting started.
Be sure to check out my unique analysis of stocks, commodities, currencies over at Bart’s Charts. Thanks for reading.
Twitter: @BartsCharts
Author does not have a position in mentioned securities at the time of publication. Any opinions expressed herein are solely those of the author, and do not in any way represent the views or opinions of any other person or entity.


: Showing Some Signs of Emerging Strength")
