This is an Intermarket Analysis chart review that I provided to my fishing club members Wednesday to prepare for the stock market downdraft I expect to continue.
These charts are meant to graphically represents relationships (strong and weak) that can foretell how the currents are moving to better identify how stocks/sectors/indices will move! You can see my last Intermarket Chart Attack here. Note my caption was “Not Done.”
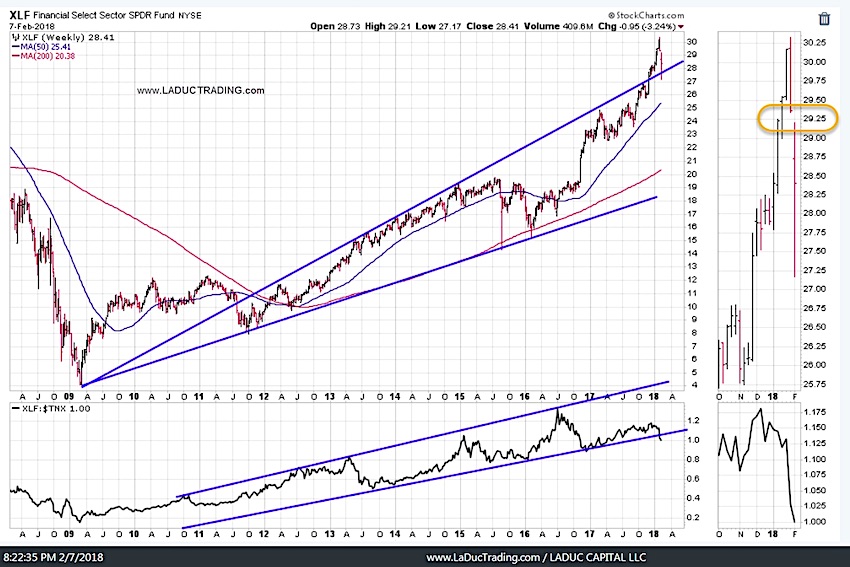
I really don’t like Financial stocks or the gap that was created by the latest market downdraft. Another way to play the financial sector and S&P 500 short is $BRKB. It is heavily weighted in both and also suffered a similar weekly gap down, whereas the S&P 500 only suffered a daily gap down along with the NIKKEI and DAX. See where I’m going with this? Not Done.
Let’s review the charts again…
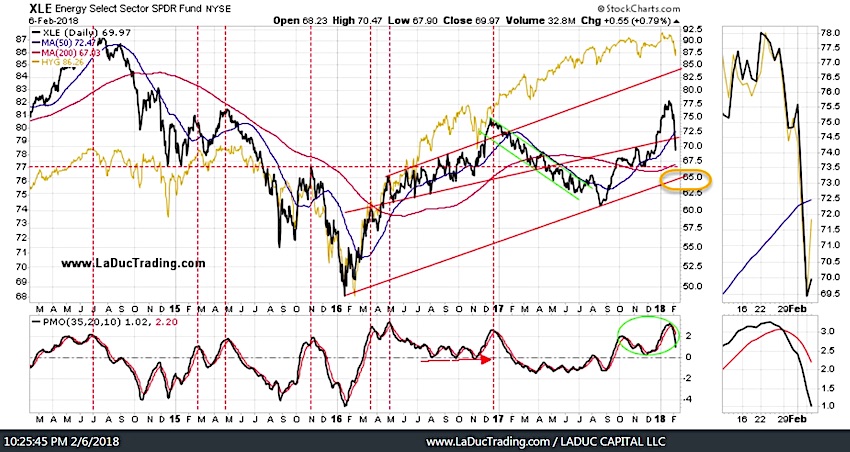
I see the Energy Sector (XLE) heading to $65 (and hope it holds for a lovely bounce). Keep in mind all those related plays that move with it: WTIC, HYG, OIH (for which we are short). Not only that but fave ETFs – XLE, XES and XOP – all have daily gaps down from Mon Jan 29, and now with Crude rolling over (started today, for which we are short), the momentum looks to continue to the downside. Not Done.
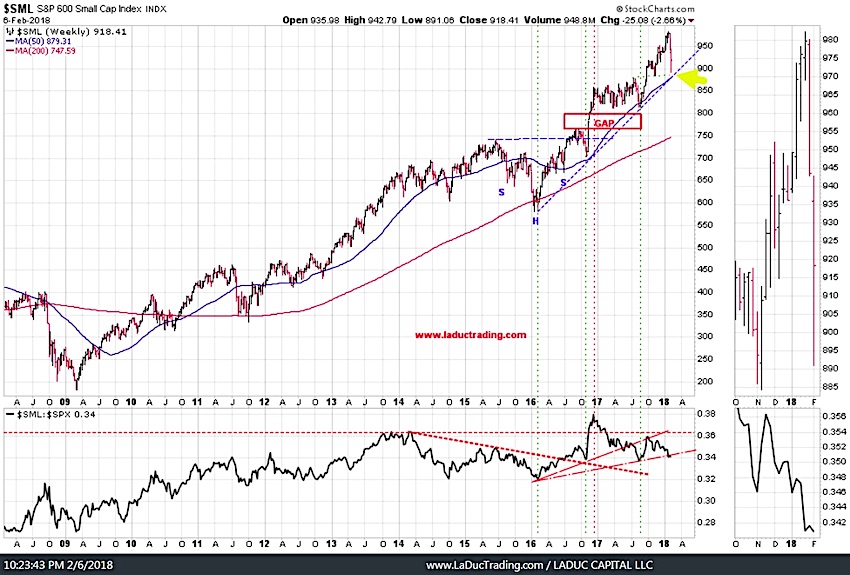
Small cap stocks are approaching strong support (yellow arrow) but there is a gut instinct in me that it will gap right below it or bounce meekly and then fail. Not Done.
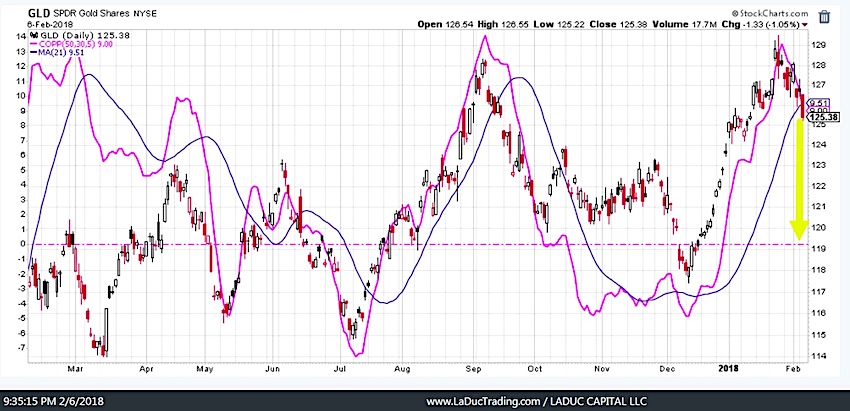
This is just trouble for precious metal bulls. And if you need a refresher on why I think commodities and precious metals/miners may fail, see my last Chart Attack where I’m presenting, and positioning, for a USD bounce. Not Done.
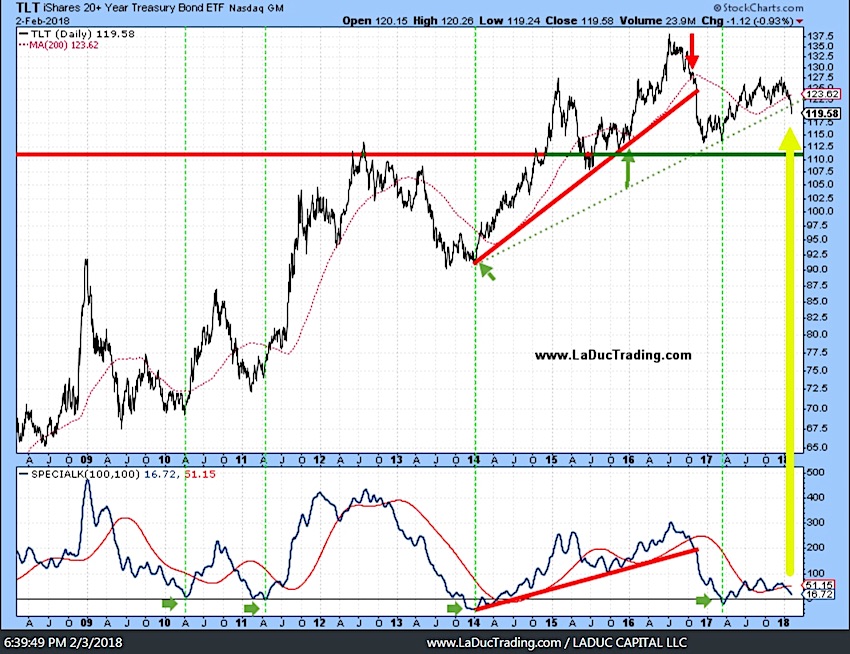
Last but not least, I am getting ready to buy bonds. I think TLT bottoms as soon as TNX hits 2.925%. I think TLT is shaking out the weak hands before it moves sharply higher and the market sharply lower. Oh wait, the market already moved sharply lower 10%, then bounced 5%. Well. I expect a retest of prior lows and that’s when the shift to safety – DXY, Bonds – will accelerate…when the prior market lows don’t hold. Just Starting.
With that, Careful and Happy Trading!
Come join me… I made it super easy for you to trade with me: 1. Pop into my LIVE Trading Room any time you want. 2. Get real-time Portfolio tracking of my trades with SMS/Email. 3. Think big picture with my macro-to-micro investment newsletter. You can also subscribe to my Free Fishing Stories Blog/Videos and find me @SamanthaLaDuc. Thanks for reading and Happy Trading!
Twitter: @SamanthaLaDuc
Any opinions expressed herein are solely those of the author, and do not in any way represent the views or opinions of any other person or entity.


