High yield bonds can often serve as a leading indicator for the equity markets. And although indexes which track high yield returns have not yet broken down, the two largest junk bond ETFs have transitioned into a downtrend.
The move lower in the junk bond market aligns with the corrective action that investors have seen in the stock market.
High yield bonds (or “junk” bonds) represent greater risk for the bondholders, and therefore tend to have higher yields. They tend to be favored in periods of lower interest rates and stronger stocks and represent an increased appetite for risk. Weakness in high yield debt could suggest a combination of higher rates and weaker stocks.
A Bloomberg article recently highlighted encouraging signs from the ICE BofAML US High Yield Index which has remained above a key support level for the last six months.
Here is the S&P U.S. High Yield Corporate Bond Index, which shows a similar pattern.
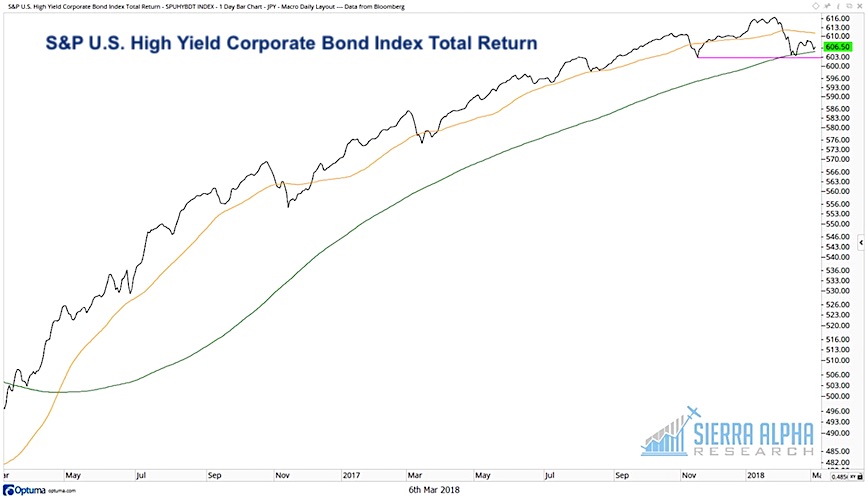
Note how this high yield index has found support at its 200-day moving average and has not yet broken to a lower low.
A quick glance at the two largest high yield bond ETFs clarifies that although these high yield indexes are holding up, ETFs tied to these assets have already rotated lower.
The iShares iBoxx High Yield Corporate Bond Fund ETF (HYG) broke through its 200-day moving average in November and has never recovered. This was followed by a period of lower lows and numerous retests of the 200-day moving average from below.
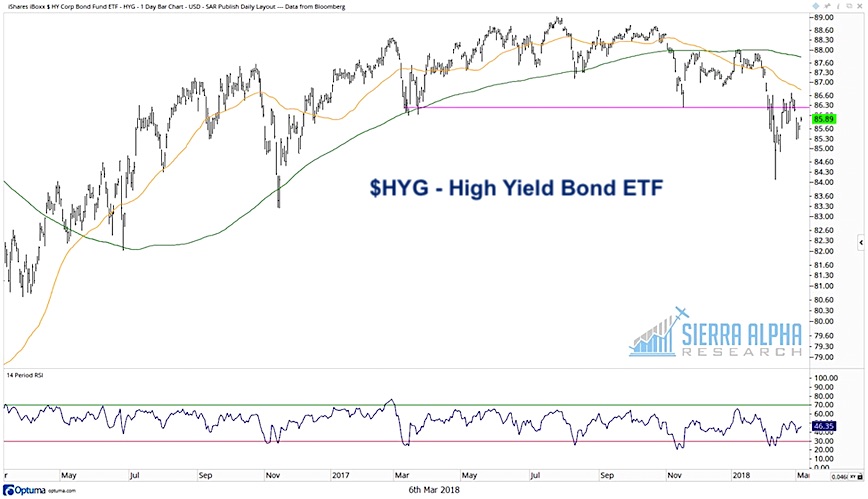
The iBoxx High Yield ETF (HYG) broke down through the key support level of $86 last month and has now settled into a range between $84 and $86.
The SPDR Barclays Capital High Yield Bond ETF (JNK) shows a similar pattern to the HYG. This Junk Bonds ETF (JNK) is also in a bearish phase, with a pattern of lower lows below two downward sloping moving averages.
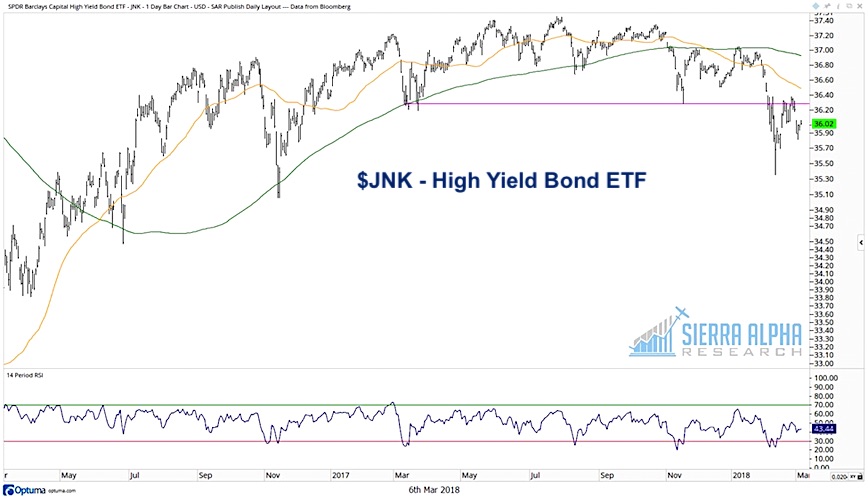
Both of these ETFs have traded higher following a recent RSI oversold condition, similar to previous occurrences over the last 18 months. However, the fact that the RSI remains below 50 suggests the trend is still negative.
I will be watching the HYG and JNK closely to see if the downtrend continues. I will also be interested to see if their weakness is confirmed by a breakdown in the high yield indexes. If so, that may suggest further downside for stocks.
You can gain deeper insights and more meaningful analysis over at Sierra Alpha Research. Thanks for reading.
Twitter: @DKellerCMT
The author does not have a position in mentioned securities at the time of publication. Any opinions expressed herein are solely those of the author, and do not in any way represent the views or opinions of any other person or entity.


: Showing Some Signs of Emerging Strength")
