The drop in equity markets and subsequent V-shaped rebound has left many traders wondering: “Is it safe to increase long equity exposure?”
With pundits on both sides making their case, we wanted to share a useful yield curve ratio to help with your equities positioning.
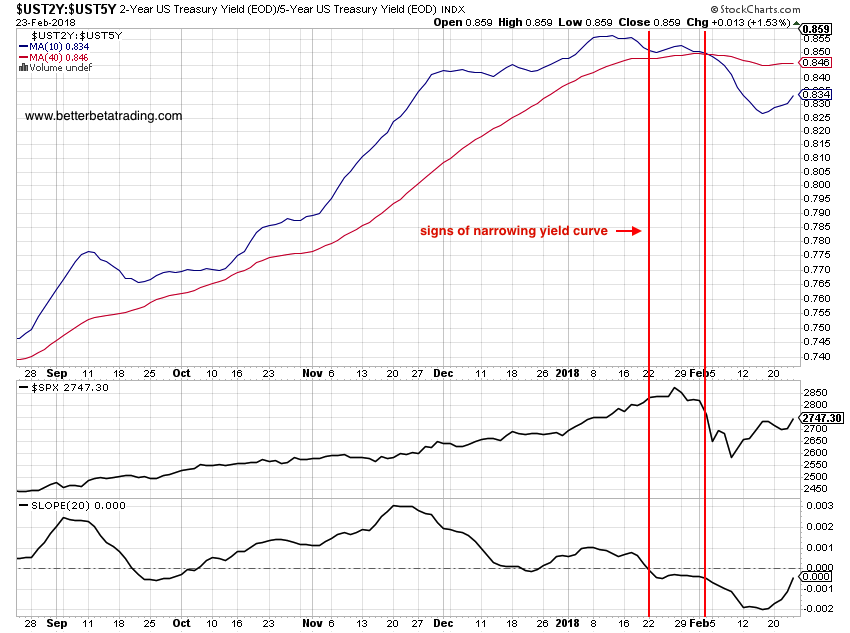
The ratio of the 2 year Treasury interest rate to the 10 year Treasury interest rate has served as a good measure of “risk-on” vs “risk-off” for equity markets. Although signs of an inverted yield curve can spell big problems for the broader markets (see Canaccord Dwyer’s dip buying filter), the movement of the yield curve ratio can help traders time their entries/exits and manage their overall exposure / risk.
Positive: A widening spread between the 2 year and 5 year yields has been positively correlated to upward equity trends.
Negative: When the ratio narrows, as measured by the relationship between the 10 and 40 day moving averages, it has been prudent to trim long equity exposure and consider downside protection.
Even in a period of artificially low rates, the bond market signals have shown to be reliable warnings. For shorter trading periods, tracking the 20 day slope of the ratio has provided earlier warning signs of possible upcoming equity weakness.
For traders who are looking to include bond market signals into their trading arsenal, we’d suggest testing yield curve measures with historical equity prices and establishing some systematic rules for managing equity exposure.
The author may hold positions in mentioned securities. Any opinions expressed herein are solely those of the author, and do not in any way represent the views or opinions of any other person or entity.
")


")
