The 10 Year US Treasury Yield is getting the attention of investors here around 3 percent.
Well, it looks to be headed higher yet in the weeks, months ahead.
Here are four chart views on the CBOE 10 Year Treasury Note Yield.
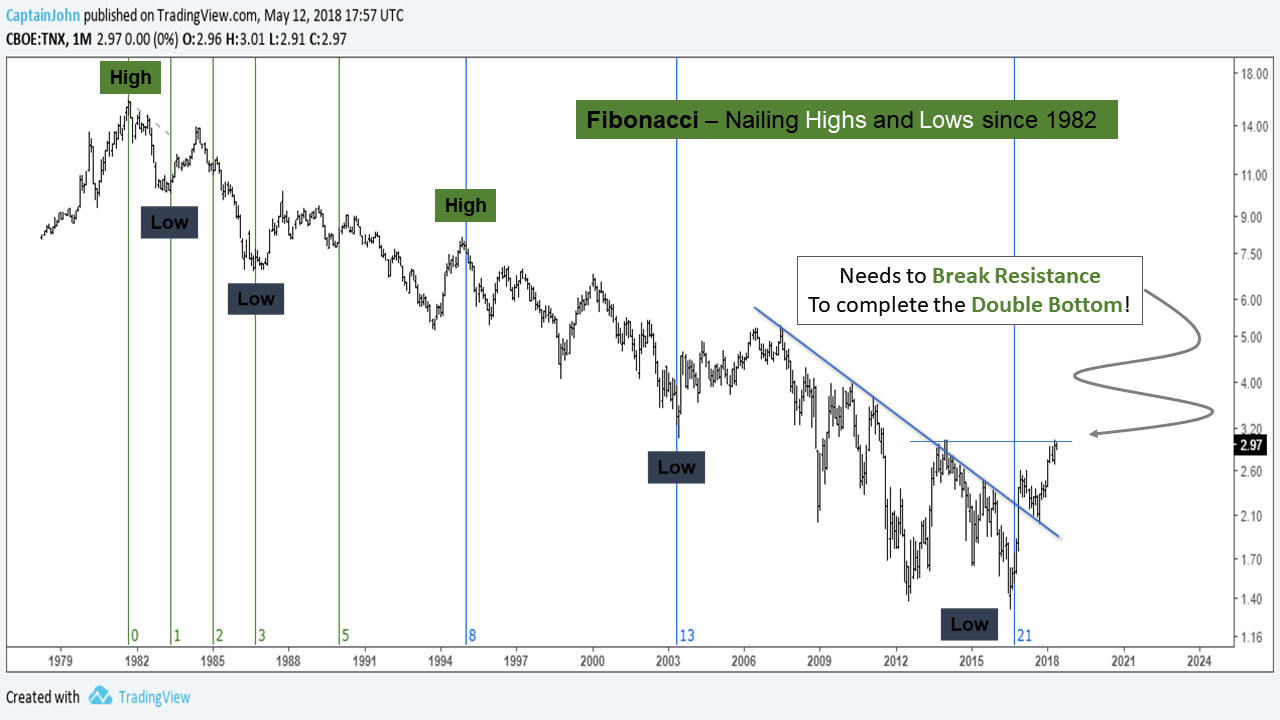
Fibonacci Time Zones: Fibonacci Time Zones are vertical lines based on the Fibonacci Sequence.
They have been nailing highs and lows since 1981 While some trendline resistance has been taken out, chart resistance in the form of a Double bottom is still in play.
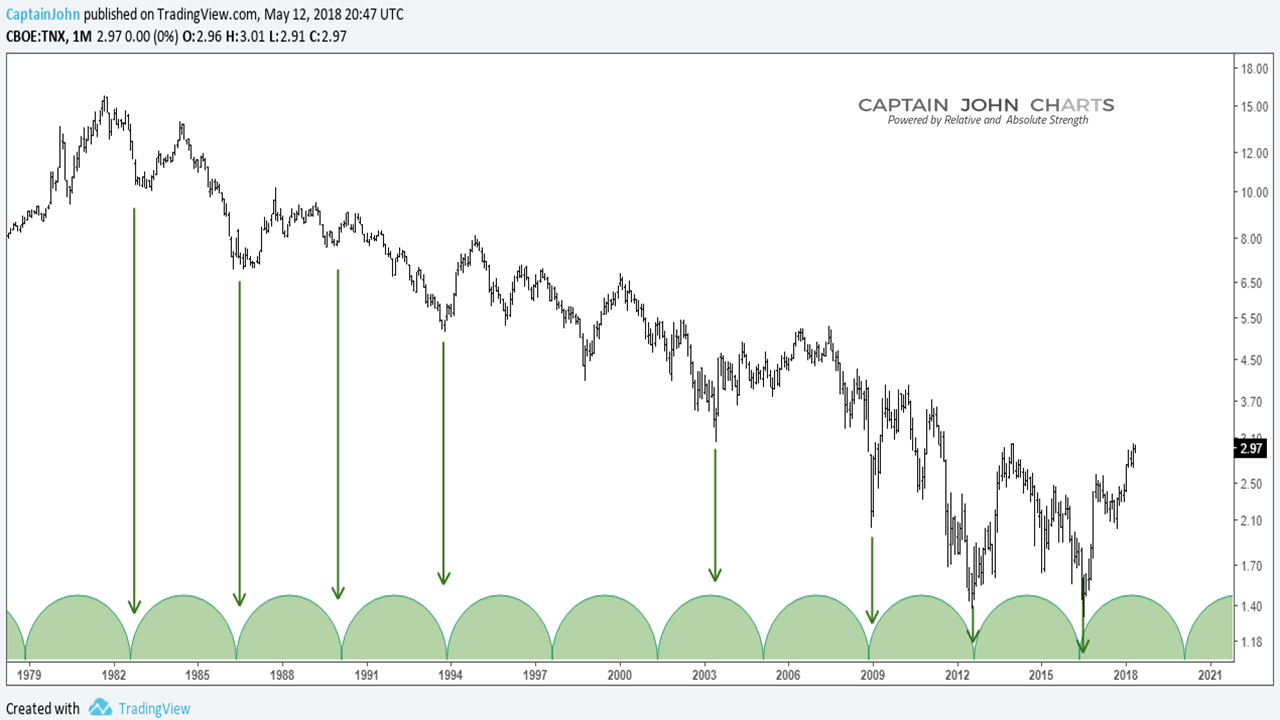
Multi Square outs have aligned at the July 2016 low for rates. These are calculated by identify a high or low and measuring to another high or low. The key is the distance (number of bars) when taking the square root needs to be a whole number. 196, 121, 64 and 49 all Square out on the July Low.

Long term Cycle lows (averaging a little over 3 years) should show up again in February 2020.
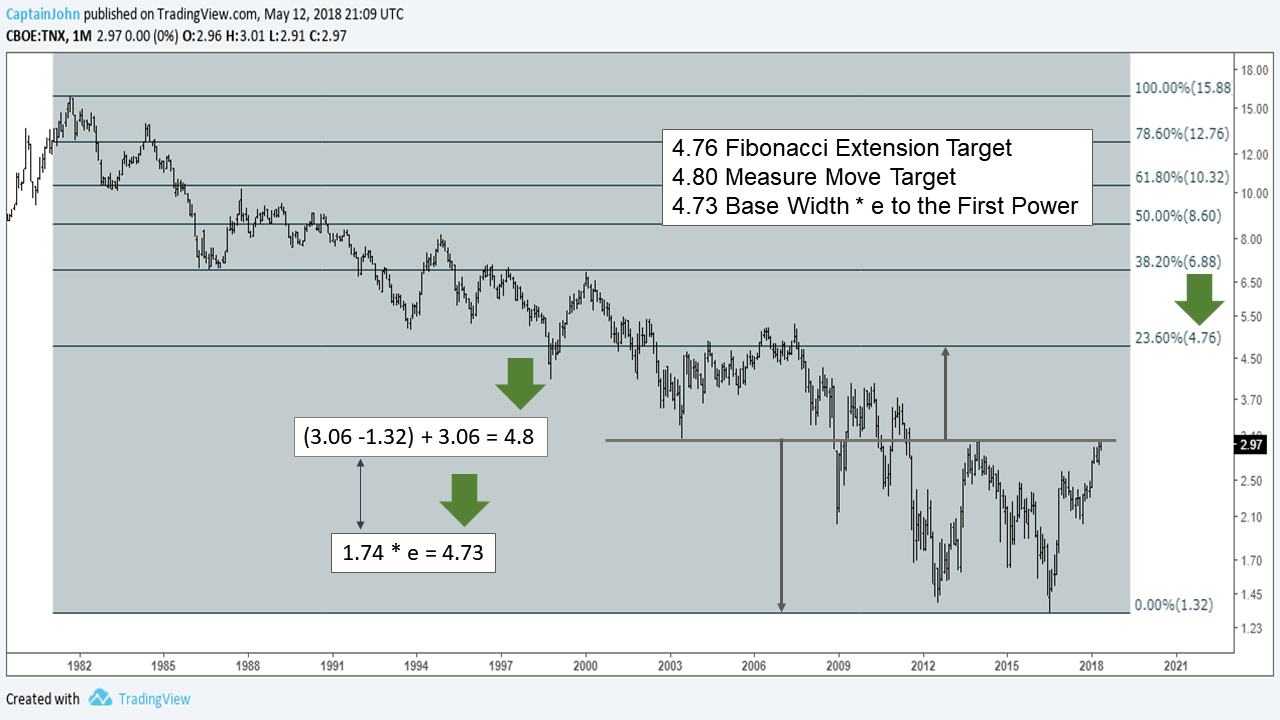
Based on our Analysis, we believe the Interest Rate on the 10 year bond has much higher to go based on Fibonacci, the measured move out of a possible double bottom and some mathematics!
Twitter: @CptJohnCharts & @FortunaEquitis
The author may have a position in mentioned securities at the time of publication. Any opinions expressed herein are solely those of the author, and do not in any way represent the views or opinions of any other person or entity.


