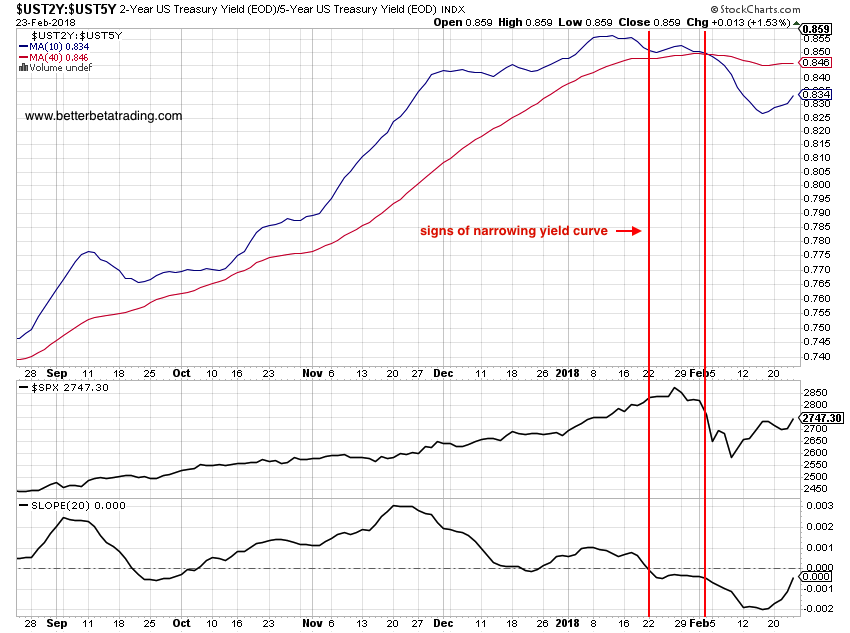
How To Use The Yield Curve As An Equities Risk On/Off Indicator
The drop in equity markets and subsequent V-shaped rebound has left many traders wondering: "Is it safe to increase long equity exposure?"
With pundits on...
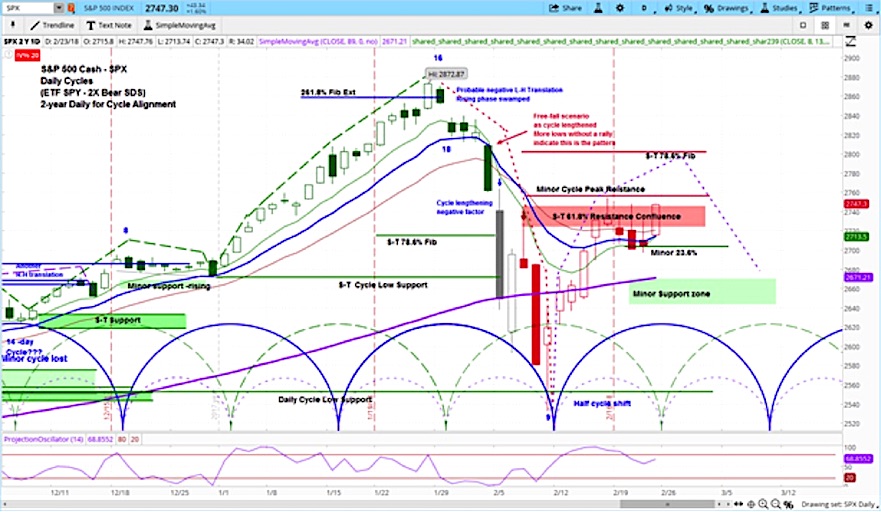
Market Outlook: Stocks Set To Continue Bounce, Then Fail
The S&P 500 reversed course on Friday and rallied back to new 3-week closing highs.
Look for stocks to extend gains into this week before...
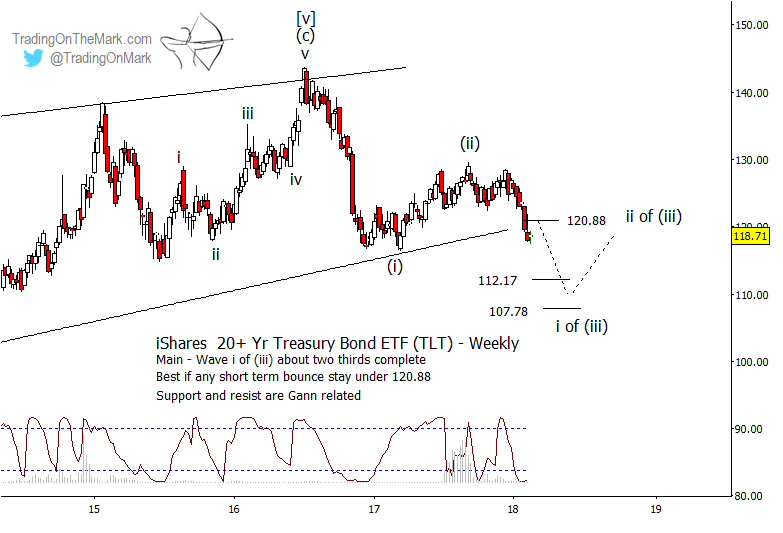
Riding The Downward Trend In US Treasuries
Our Elliott wave forecast for treasury bonds continues to hold up well. In June 2017 we described the minor rally during the first part...
Intermarket Chart Attack: Not Done (Part 2)
This is an Intermarket Analysis chart review that I provided to my fishing club members Wednesday to prepare for the stock market downdraft I expect to continue.
These...
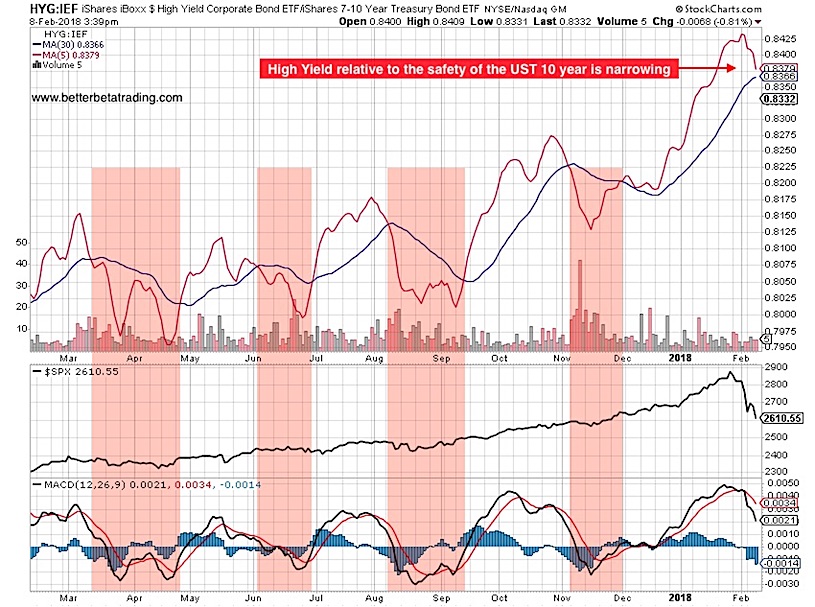
Bond Yield Spreads Don’t Bode Well For Equities
With the recent equity market turmoil, many traders and investors are looking for signposts. Is the sell-off contained to equities and VIX-related ETPs or...
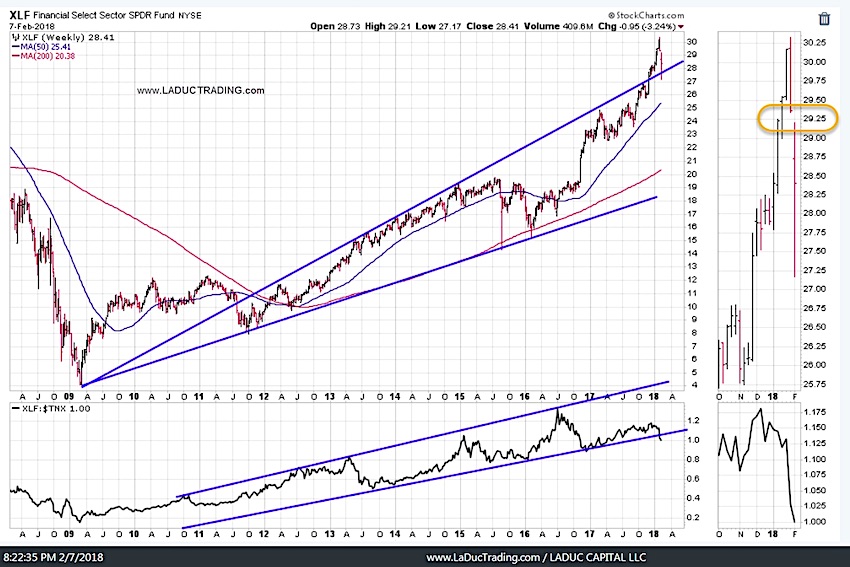
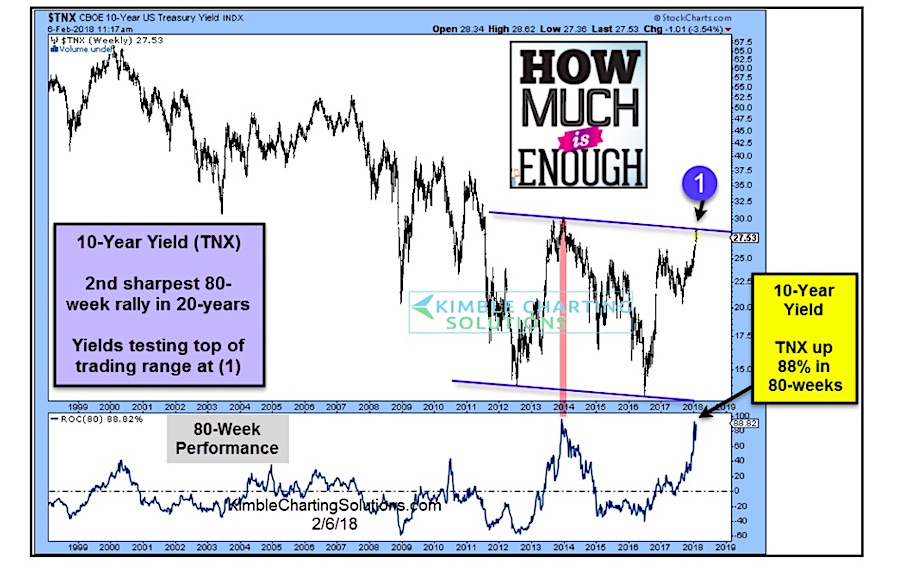
Are Rising Interest Rates About To Hit A Wall?
Rising interest rates are finally getting some attention here, and by all accounts, investors are concerned!
The rate with which treasury yields have moved higher...
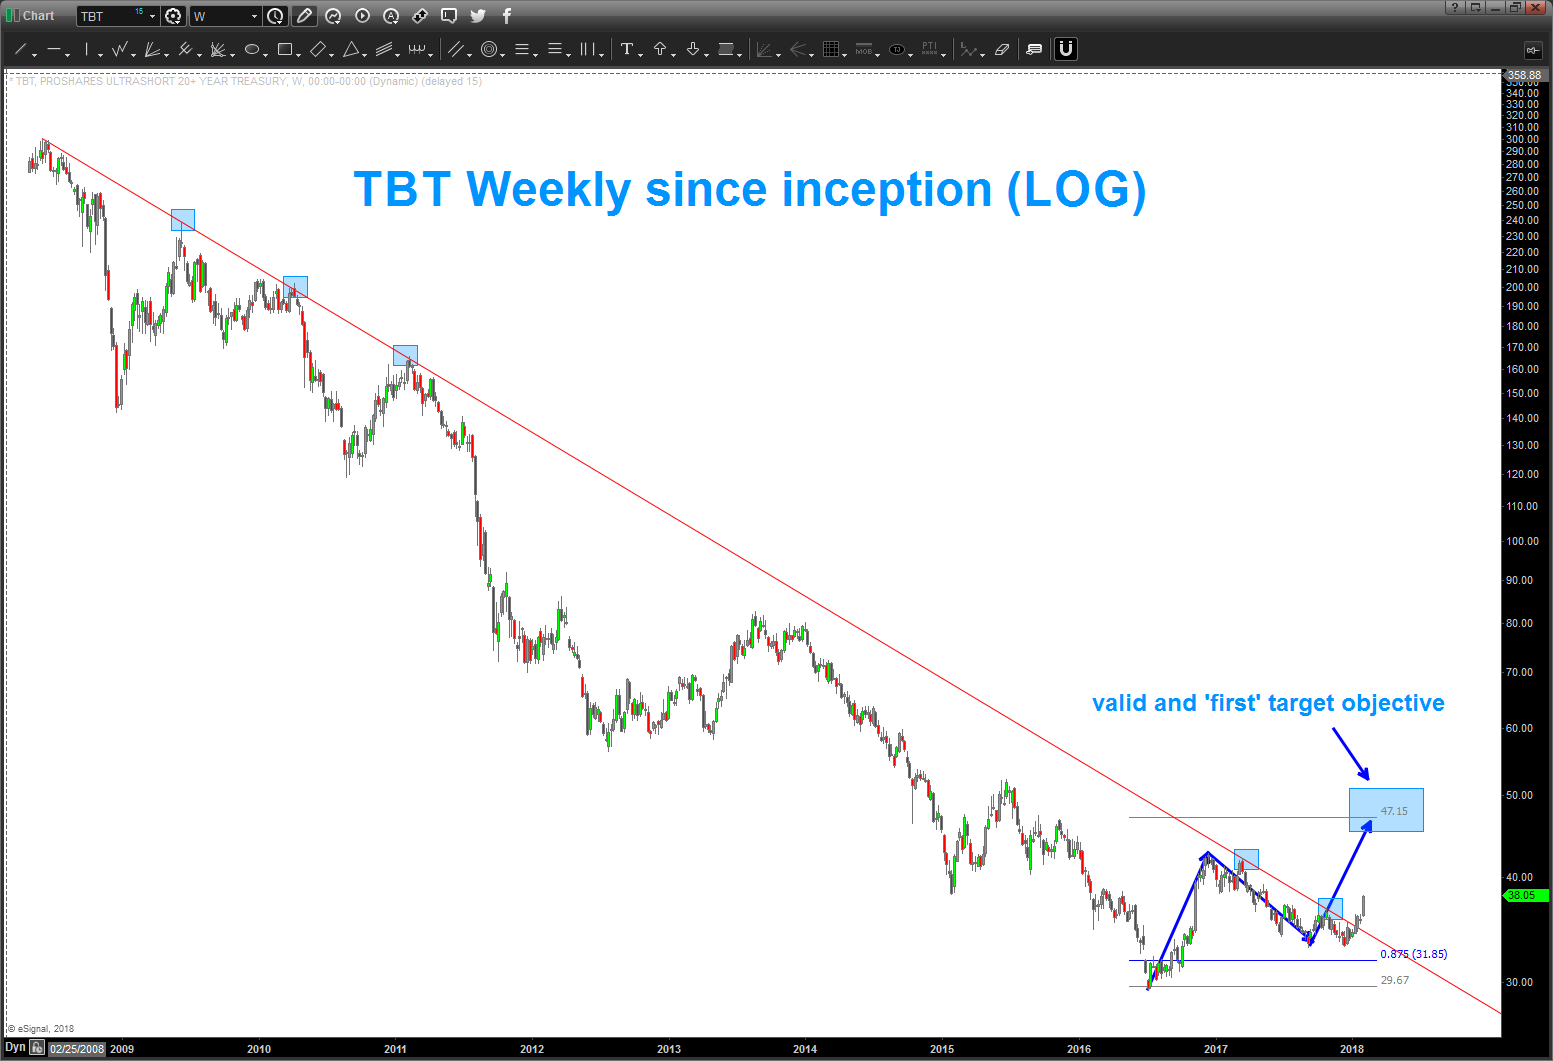
Short Bonds ETF (TBT) Breaks Out On Rising Treasury Yields
Back in December, I wrote a blog about rising rates and the impending breakout for the Ultrashort Treasury Bonds ETF (TBT).
Since that post, treasury...
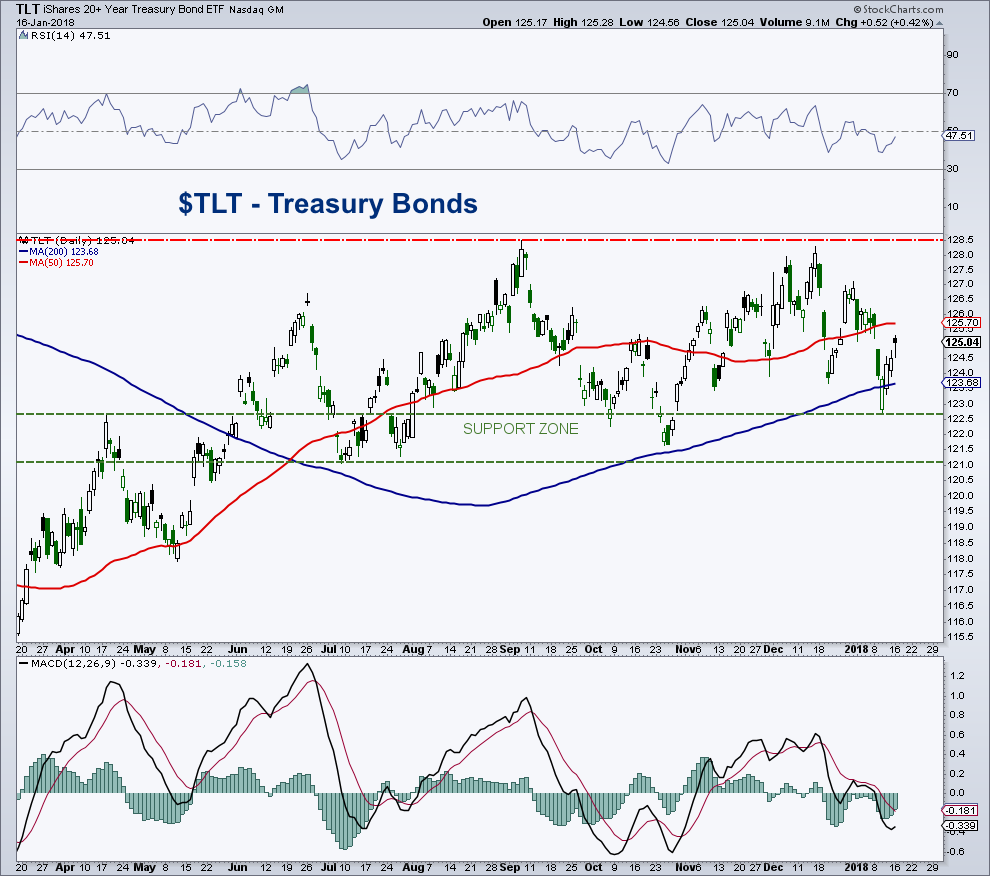
Treasuries Update (TLT): Bond Bulls Have Work To Do
iShares 20+ Year Treasury Bond ETF (TLT)
On the daily chart (shown below), TLT remains extremely subdued, showing little change over the past seven months....
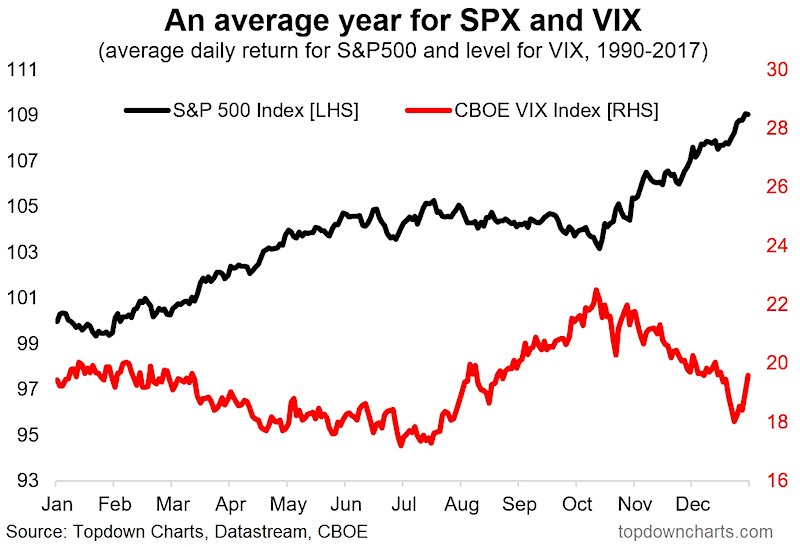
Market Seasonality Composite Charts For Stocks & Bonds
Earlier this week, I shared some stock market seasonality charts on my research blog and Twitter feed. I'd like to highlight a couple of...
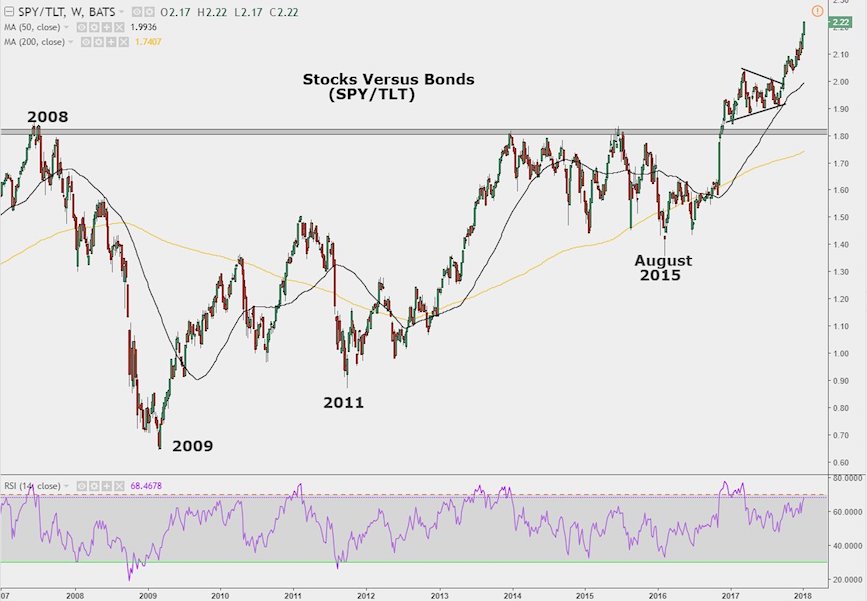
Stocks To Bonds Ratio (SPY/TLT): Parabolic Rally
One of the more interesting relationships to watch is the price relationship of stocks to bonds.
Investors can watch this performance battle using a ratio...

