6 Stock Market Themes Investors Should Watch Into August
With the S&P 500 (NYSEARCA: SPY) trading toward the all-time highs from January, it's important to look at some of the key stock market...
Weekly Market Trends Update: Pause Possible, But Bull Alive
The stock market has stalled out and traded sideways for several days.
Is it ready to turn lower, or simply consolidating? Today, we take a...
Interest Rates Rising At Fastest Clip In 20 Years!
With the Federal Reserve in interest rate "hike" mode, the market is on edge about the speed with which rates will rise.
Rates have been...
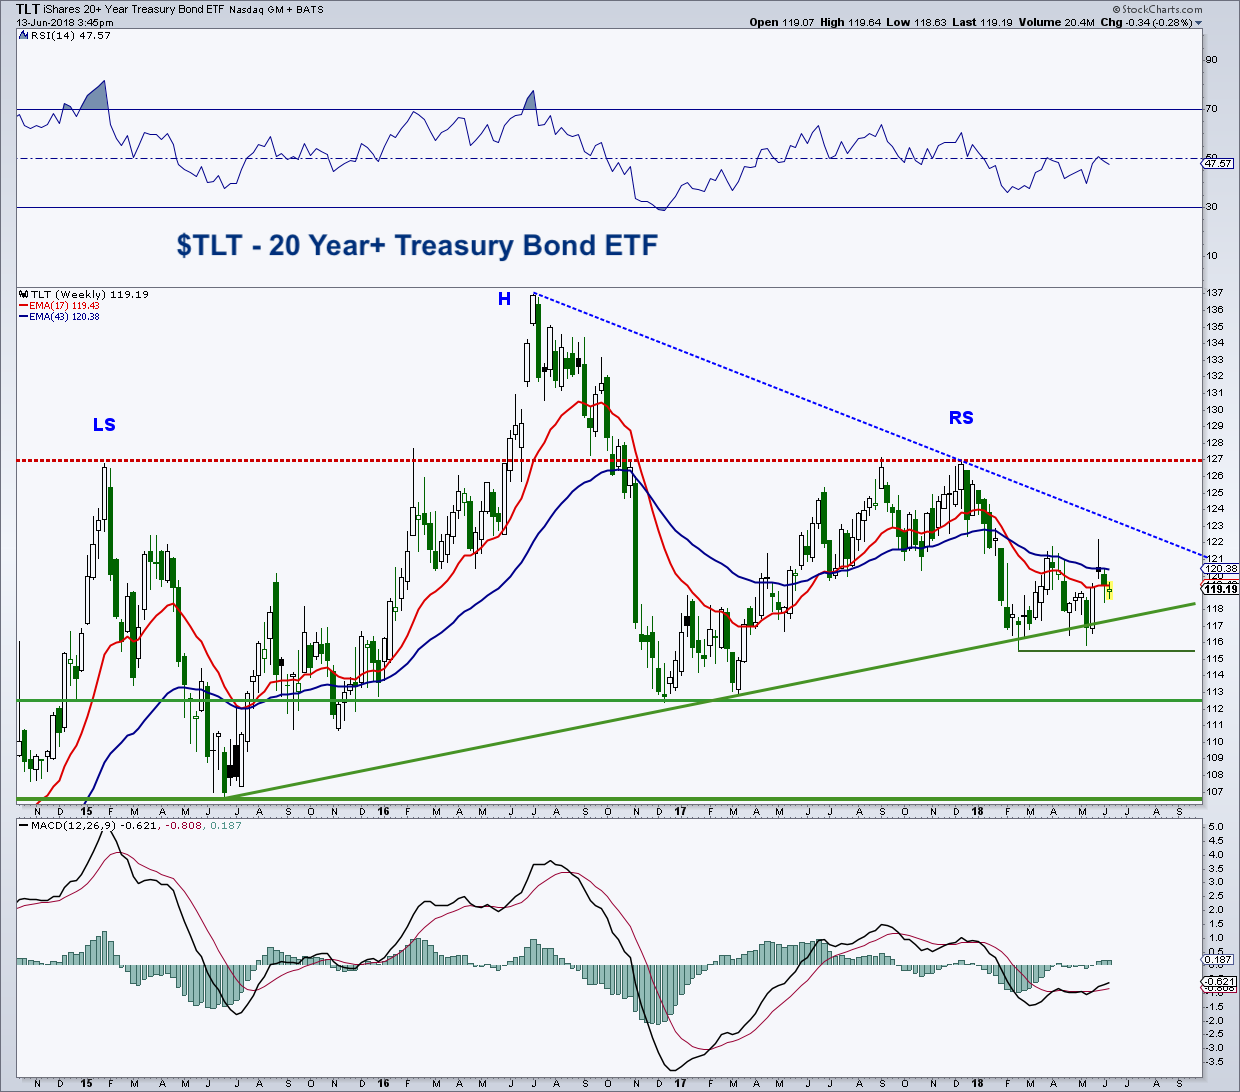
Are Treasury Bonds Setting Up For A Rally?
Looking at the weekly chart of the iShares 20+ Year Treasury Bond (TLT), we are seeing price trying to breakout from a potential double...
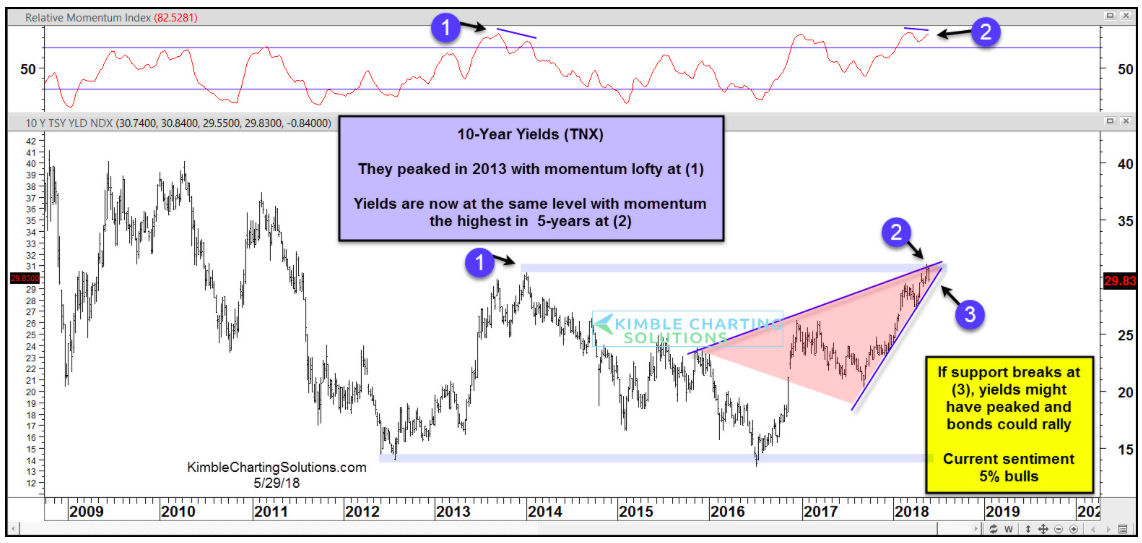
Interest Rates Losing Momo? Bull-Bear Battle At 3 Percent
Interest rates have been creeping higher over the past several months.
This has increased investor uncertainty to levels not seen in a couple years.
Many are...
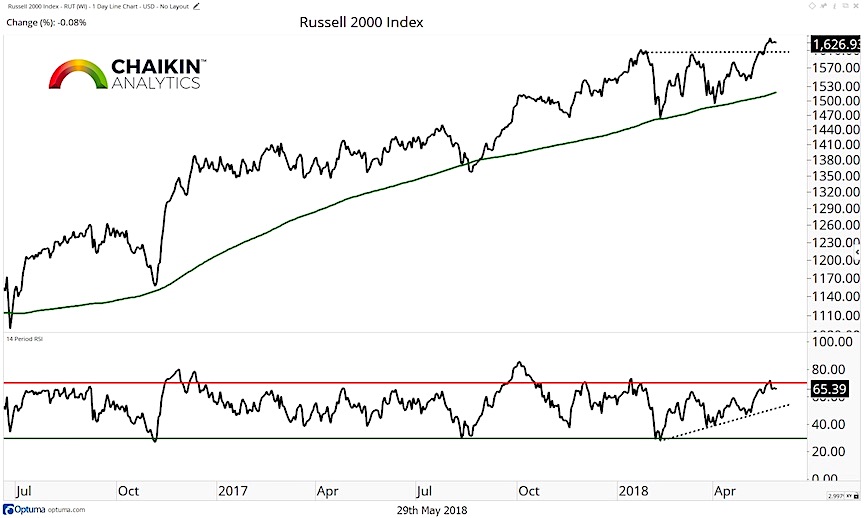
Macro Technical Trends & Insights: Small Cap Leadership
The 24-7 news cycle adds an additional layer of noise to what's happening in the marketplace.
Though it's good to be up on news and...
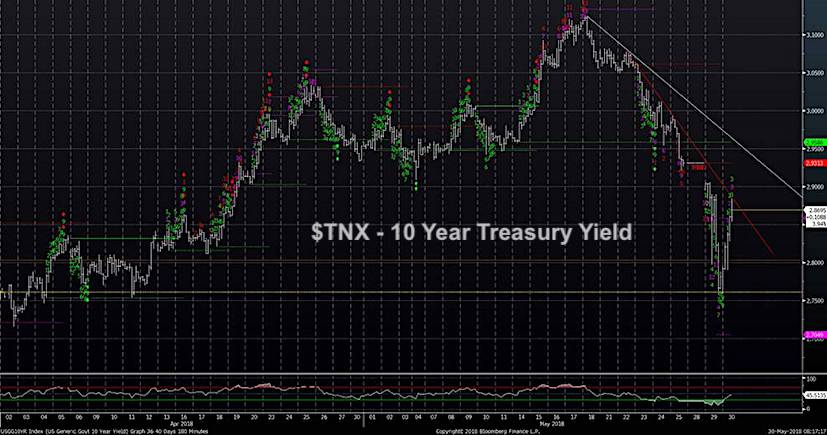
10-Year Treasury Yield Driving Broad Stock Market Indices
Heading into this week, it was seen as "more" probable that strength in Technology and Industrial stocks would carry stocks higher despite the increasing...
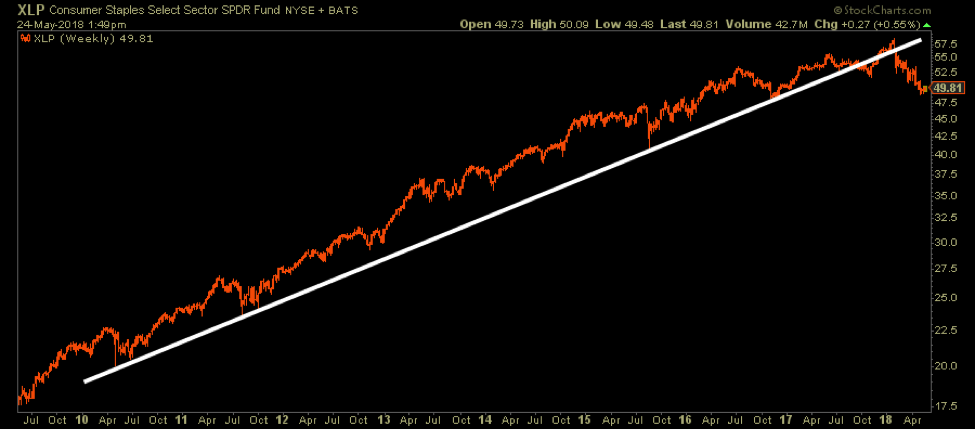
Consumer Staples Sector Update: Will The Free-Fall Continue?
Note that this post with written with my friend Arun Chopra of Fusion Point Capital.
Last Halloween we shared some spooky charts.
On the top...
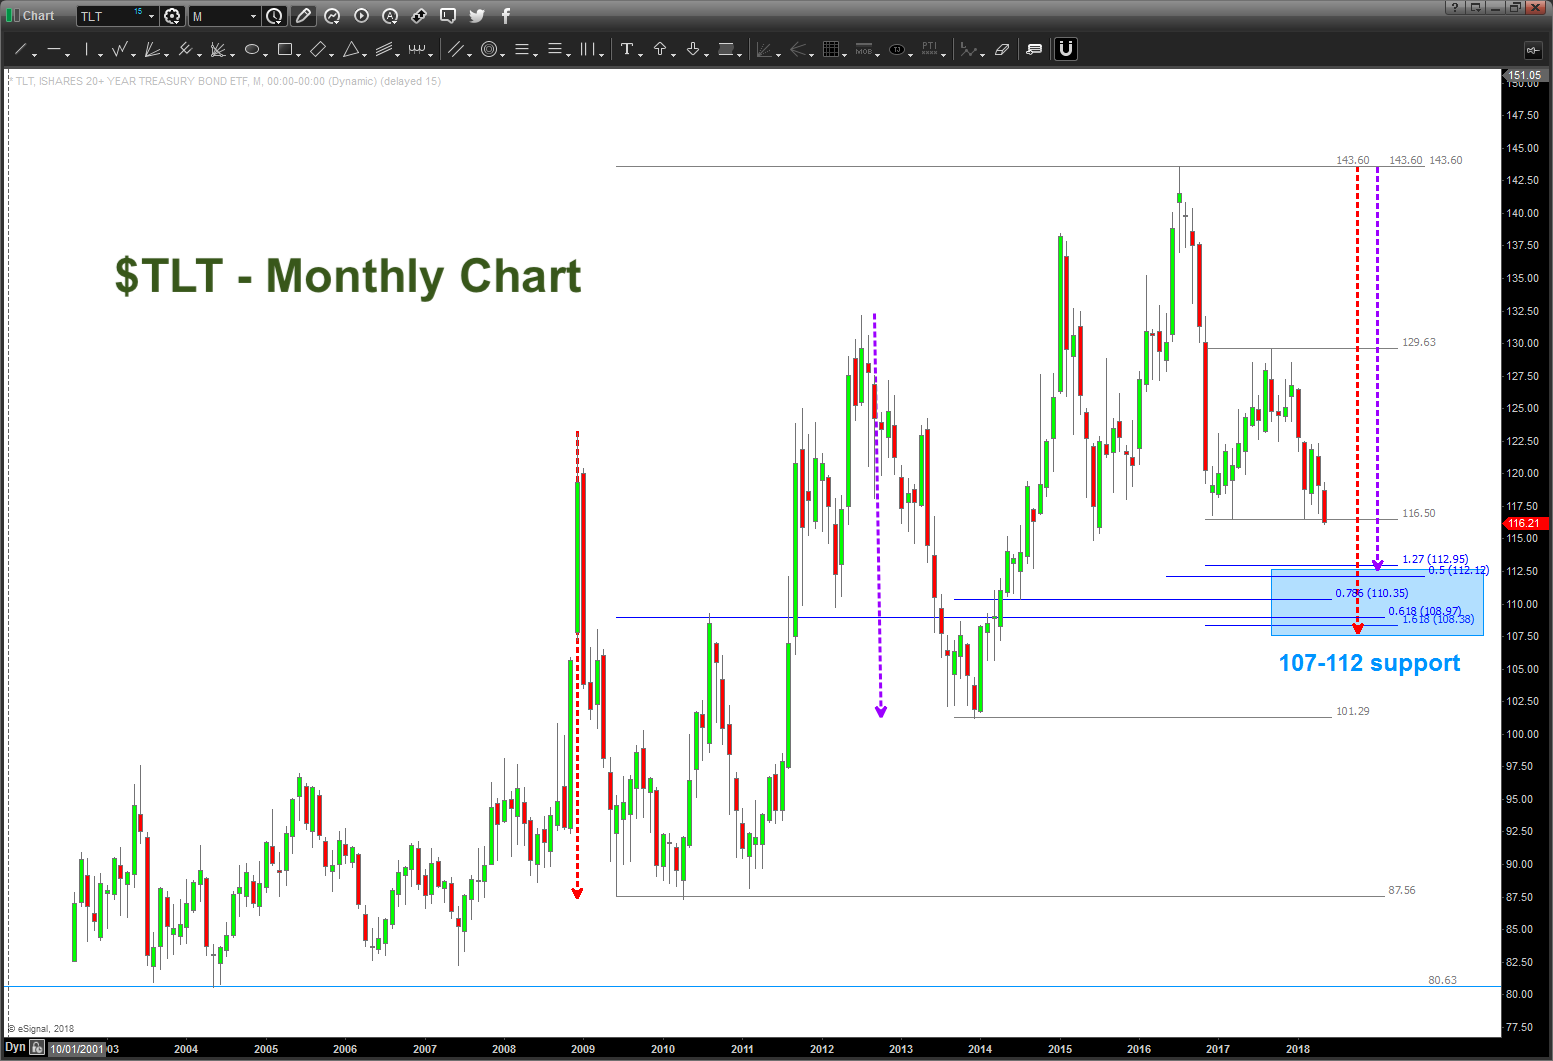
Treasury Bonds Top Heavy, But Sliding Into Support Area
Almost two years ago, we focused on a measured move target and the 145 area as potentially strong resistance and topping points for Treasury...
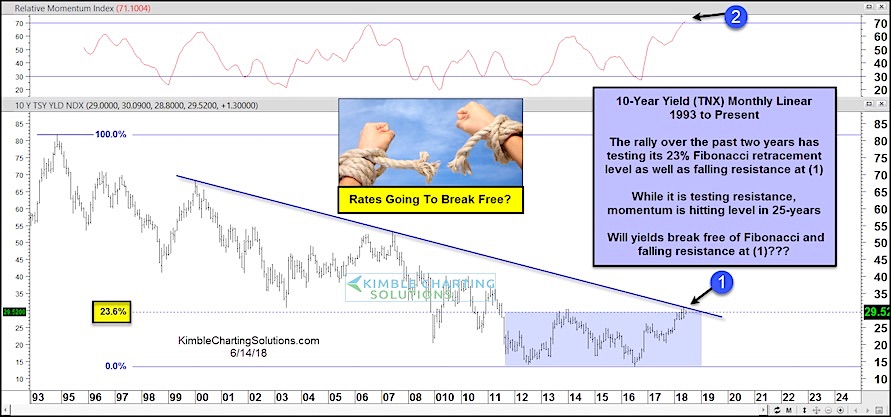
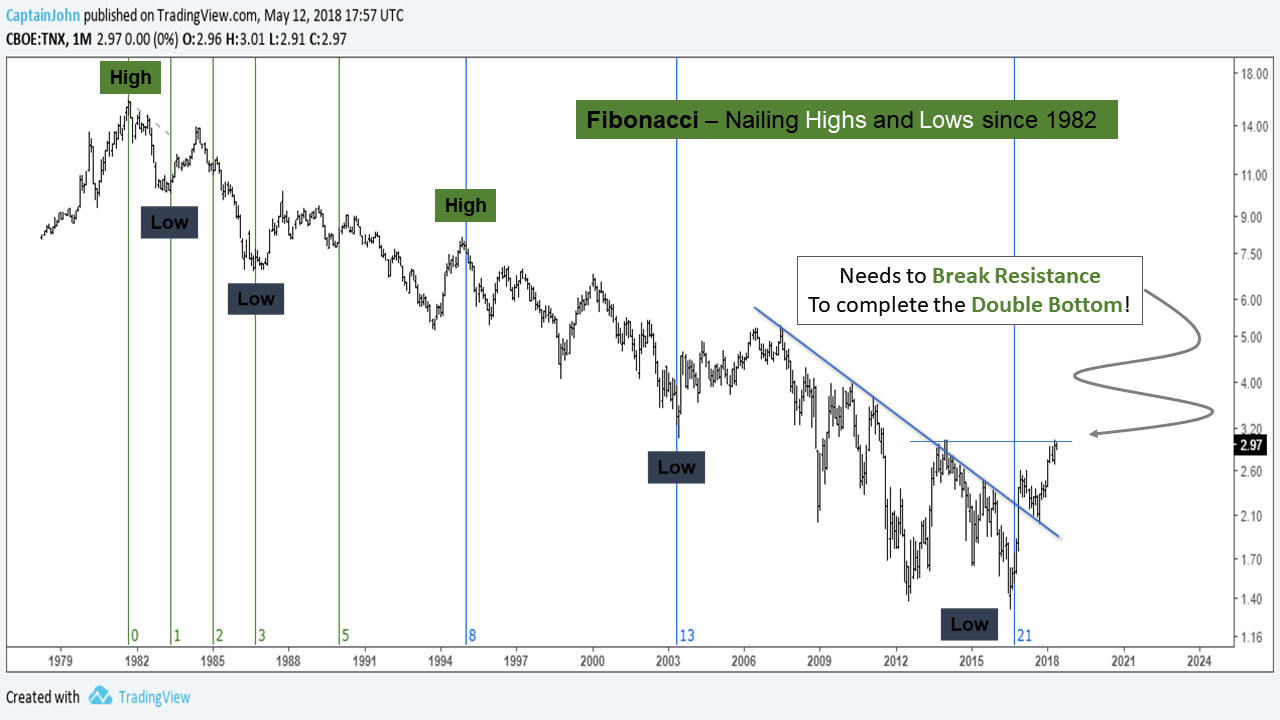
10 Year Treasury Yield Long-Term Outlook: Charts Point Higher
The 10 Year US Treasury Yield is getting the attention of investors here around 3 percent.
Well, it looks to be headed higher yet in...


