In todays article we will take a look at some clear Elliott wave pattern that we are tracking it on 10 year US notes.
This is also very important market that can tell us a lot about other correlated global markets.
If you are correct with the prediction on 10 year then you may spot some interesting developments and even trades in other markets.
Normally I track 10 year US notes to get a clearer perspective about the stock market and USDJPY, or JPY in general.
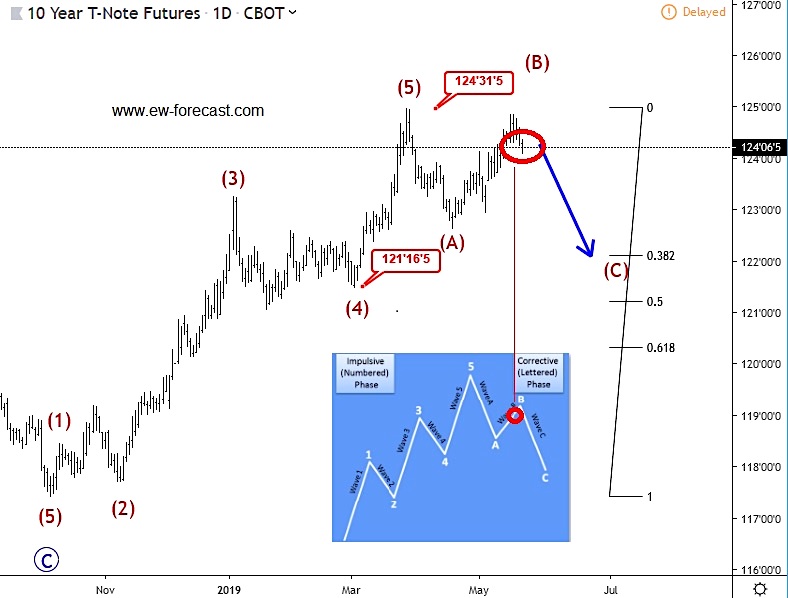
On the chart above we see that 10 year US notes are in uptrend from 2018 low, clearly with five waves up so if we respect the 8 -wave cycle of Elliott Wave model then current reversal from above 124 should be a three wave move, unless this becomes more complex correction.
But as always I like to stick with the basics. So idea is that market already found a top, turned down for wave A, then bounced for B and now at reversal zone for a new leg down; wave C. Actually, that can be a very nice bullish set-up in a few months, but for now, it looks like it may go lower.
Well, what is interesting is that US stocks made a nice set-back from the all-time highs, exactly when everyone expected a major breakout.
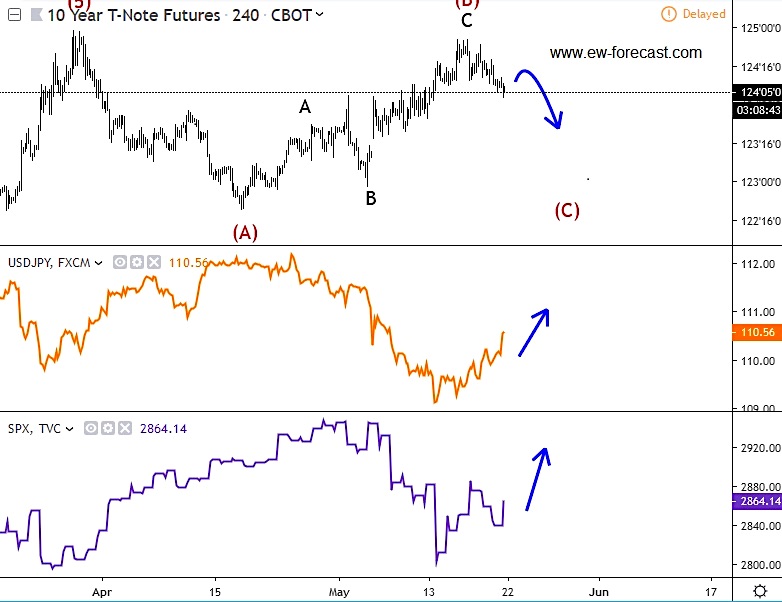
The stock market set-back occurred when 10 year US notes stabilized a little and recovered into wave B. So question is what will happen now if 10 year is really going to see weakness?
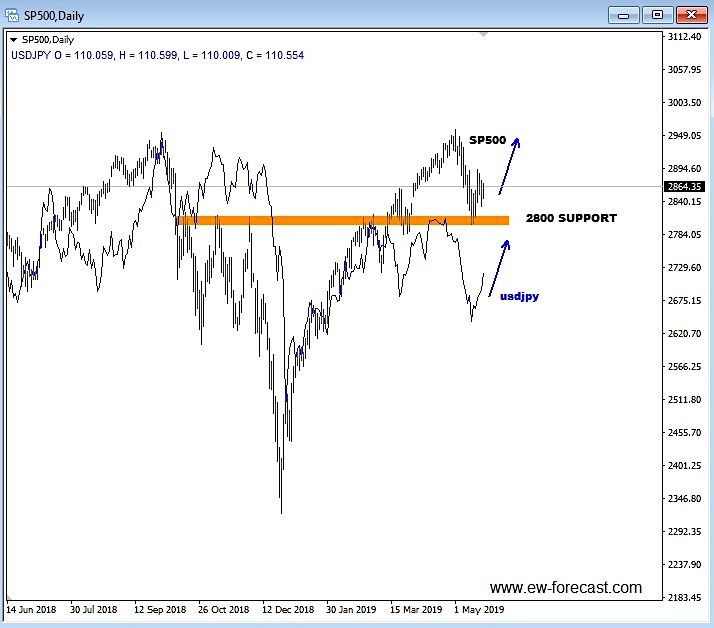
In my opinion, I think that stocks can see a support, especially if we respect the important of very nice 2800 support on the SP500. If that is going to be correct, then we can expect xxxJPY pairs to rise as well.
I am definitely interested in some of the xxxJPY pairs for longs, but firstly have to see more evidence of a completed decline.
I hope that you enjoyed the article.
If you like my Elliott Wave analysis, then I welcome you to visit my website and check for more content. Trade well.
Twitter: @GregaHorvatFX
The authors may have a position in the mentioned securities at the time of publication. Any opinions expressed herein are solely those of the author, and do not in any way represent the views or opinions of any other person or entity.


 Flirting With Critical Support… Again")