The bearish scenario for treasury bonds that we described in September and again in October appears to be on track.
Today’s post shows some upward targets for the Treasury Bonds rally, by way of the TLT, that nimble traders might play for, as well as price areas where the next strong downward move might begin (for trading the short side).
Also, our next post will examine the potential for corresponding moves in equity markets.
Longtime readers will remember that we followed treasuries through their climb up a multi-year channel and then watched price break downward, as expected, out of the channel. Looking farther back, our main scenario counts the entirety of the downward move from the 2016 high to the late-2018 low as the first wave of a larger downward pattern.
Here we use the iShares 20+ Year Treasury Bond ETF (NYSEARCA: TLT) to show our main bearish scenario.
When we reviewed the scenario in September, the long-dated treasury bonds ETF (TLT) and bond futures were nearing the end of the sideways consolidation you can see on the chart below, labeled as small wave ‘iv’ of (v) of [i]. Shortly after that post, price moved downward to complete small wave ‘v’ as expected.
With the completion of wave [i], TLT and treasury bonds now appear to be in the midst of a wave [ii] bounce. For traders, there are several considerations here as this wave of the treasury bonds rally winds down.
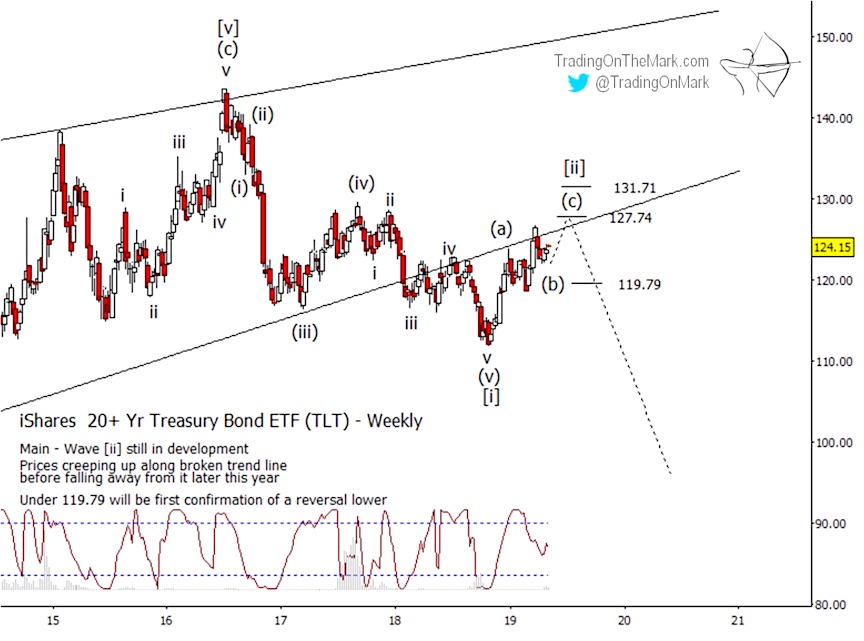
The wave [ii] bounce might take the form of a relatively simple (a)-(b)-(c) pattern as shown on the TLT chart. An alternate scenario, still bearish, would have wave [ii] extend longer in time and develop a more complex pattern. We somewhat favor a simple, quick resolution for several reasons.
Even so, the resistance areas marked on the TLT chart at 127.74 and 131.71 should be relevant during the next several weeks regardless of whether wave [ii] remains simple or becomes more complex. Nimble traders might still play for those as near-term targets.
The same resistance levels are candidates areas where a strong downward wave [iii] to begin. With the next downward move, a decisive break of previous resistance, now support at 119.79 should serve as fairly good confirmation that wave [iii] has begun.
Some of the reasons we favor a quick resolution to the TLT bounce are related to elements of the chart for the Treasury 30-year Yield Index (INDEXCBOE: TYX) shown below. In that framework, a downward wave ‘ii’ in TYX corresponds to the wave [ii] bounce we described above for TLT.
The downward move in yield is approaching important support areas at 27.61 and slightly lower at 25.70. If those levels hold, we expect an upward reversal in yield to happen concurrently with a strong downward wave [iii] in bonds and TLT.
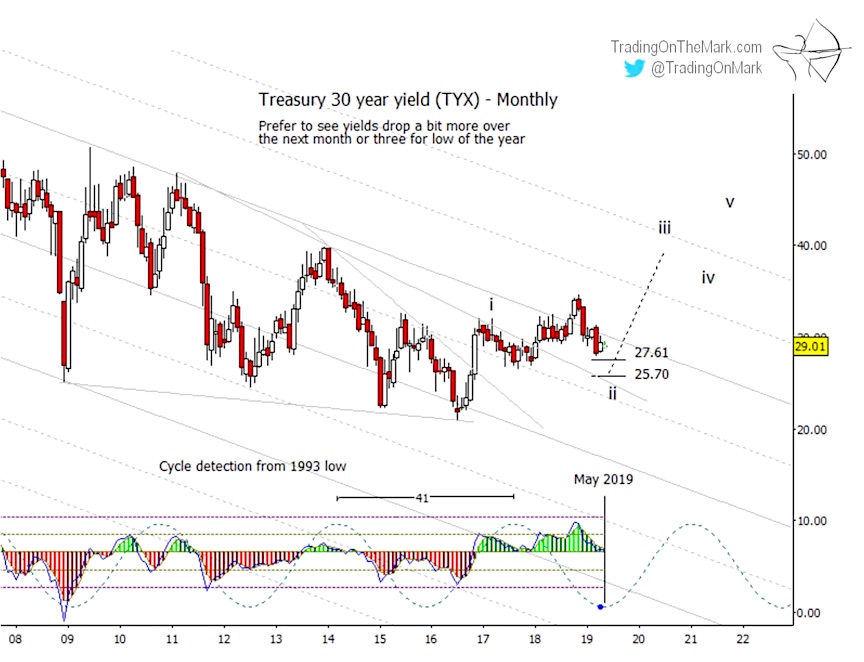
Another important consideration is the upcoming inflection in the 41-month cycle that has been working fairly well on a yield chart. Although we don’t necessarily expect the precise turning point of May 2019 to be the local low in yield, it marks the point beyond which the cycle favors upward yield moves. The actual low in yield and a local high in bonds might be expected sometime during the next three months.
Happy spring! With increased volatility in the markets, trading with the right charts gives you a real edge. For the rest of May we’re making an introduction to Trading On The Mark available to new subscribers with a big 20% price reduction. Just use the coupon code TULIP on the “Subscribe” page to claim your savings.
Twitter: @TradingOnMark
The authors may have a position in the mentioned securities at the time of publication. Any opinions expressed herein are solely those of the author, and do not in any way represent the views or opinions of any other person or entity.


 Flirting With Critical Support… Again")


