Part I of this post described how bond prices and stock indices might dance a circle around each other during a decline into 2019 and possibly beyond. Read that post here.
Now let’s examine what the effects of a misstep by either party might look like on a bond chart.
Who’s leading this dance? Probably bonds.
It’s not clear yet whether the next big shift will be precipitated by a breakdown in bond futures or stock indices. When one of them initially stumbles, the other will probably find its footing for at least several months.
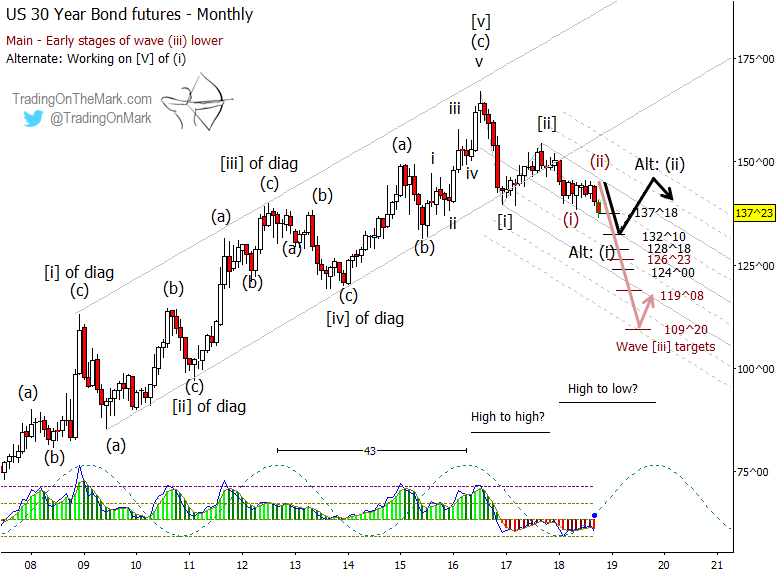
Because the factors that affect bond prices are right now more predictable, and because we also view an eventual decline in bonds as inevitable, our main Elliott wave count has bonds breaking down sooner rather than later. On the chart here, the main scenario is shown with the red colored path.
If that scenario proceeds, then bonds would be declining in a middle third wave, usually the strongest wave in an impulsive pattern. Looking at the “red scenario”, likely price supports based on the magnitude of wave (i) of [iii] are near 126^23, 119^08 and possibly 109^20.
With a near-term breakdown in bonds, there will be a tendency for fund managers and other big investors to shift assets into equities. That would produce a stock rally that could take the major U.S. indices to new highs, which we have described as our main scenario for stocks [link].
What if stocks precipitate the move instead?
As we noted earlier, we view a long-term paired decline in bonds andstocks as inevitable. We note that stock indices appear to be near completion of their own topping patterns. It could even be true that peak equities are behind us, although we regard that as the less likely scenario.
If stock indices such as the New York Composite Average and the S&P 500 do indeed break much beneath recently tested supports, and if the stock decline accelerates, that may forestall an immediate decline in bond prices. That is our alternate scenario for stocks, and it would move to the forefront our alternate scenario for bonds, marked here in black.
With the alternate, less immediately bearish Elliott wave count in bonds, we would watch for support near the 137^18 area currently being tested and near other Fibonacci-based levels at 132^10, 128^10, or even as low as 124^00. Any sharp decline in equities could produce a bounce from one of support levels in bonds depending on which level bonds are nearest at the time.
The question really comes to which dance partner is going to stumble first.
Join us at Trading On The Mark as we chart and trade the moves! Trading On The Mark helps subscribers stay on top of the moves with twice-daily updates for the Dollar Index, Euro futures, the S&P 500, crude oil, treasury bonds, and gold.
Between now and October 31, new subscribers can lock in savings of 15%on all of our services. The coupon code for the special offer is “fractal”.
Twitter: @TradingOnMark
The authors may have a position in the mentioned securities at the time of publication. Any opinions expressed herein are solely those of the author, and do not in any way represent the views or opinions of any other person or entity.


