Investing Outlook Highlights:
Federal Reserve Counseling Patience but Market Looking for Cuts; Economic Confidence Being Tested
Excessive Stock Valuations Could Dampen Returns
Household Equity Exposure Still Elevated
Small-Caps Not Providing Leadership; Breadth Trends Consolidating
The stock market rally that began in earnest in late December has carried through most of the first quarter. The S&P 500 is on pace to follow the worst quarterly decline since 2011 with the best quarterly gain since 2009.
While the S&P 500 climbed to new recovery highs in March, the weight of the evidence has remained neutral and divergences have begun to accumulate. Small-caps have not confirmed the strength in large-caps, with the Russell 2000 down 3% in March in so far. The Broker/Dealer Index and the Dow Transports have also retreated since peaking in mid-February.
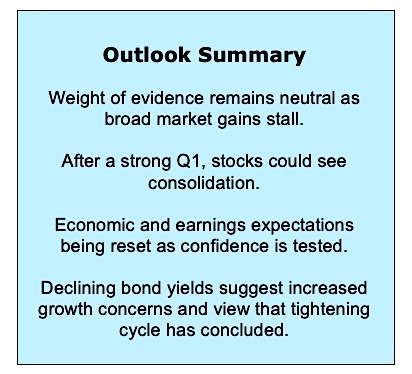
With some cracks emerging in the rally and the weight of the evidence still neutral, a period of consolidation in the second quarter would not be surprising.
While a meaningful test of the late 2018 lows cannot be ruled out, neither is such a test inevitable. On the constructive side, a modest pullback could clear up divergences, relieve investor optimism and prove to be pause that refreshes. From a more defensive perspective, economic confidence could weaken further as fundamentals deteriorate and the breadth improvements seen in 2019 could prove short-lived.
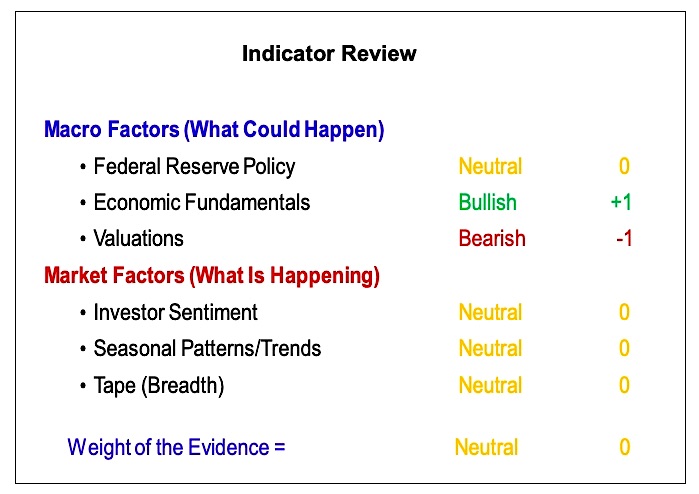
While leaning in favor of a positive outcome, it is premature at this point to dismiss the possibility of needing to turn more defensive.As we move into the second quarter, our attention is most keenly focused on Fed Policy, Economic Fundamentals, and Breadth.
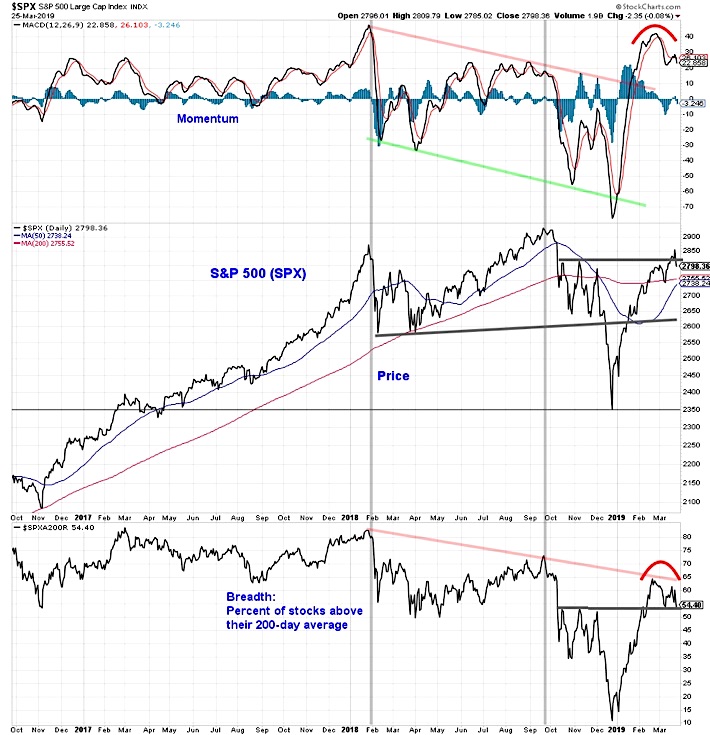
Not all cracks become crevices, but crevices begin as cracks and those can be seen in the 2019 rally’s façade. Divergences have emerged within the S&P 500 indicators as well.
The index itself moved to new recovery highs in March, but neither momentum nor breadth confirmed these highs.
This is in contrast to the early stages of the move off of the late-2018 lows, when breadth and momentum were encouragingly stronger than price. The stalling out in breadth is particularly worrisome.
While the percentage of stocks trading above their 200-day averages has surged from near 10% late last year to nearly 65% in February, it has failed to break the pattern of lower highs established over the course of 2018 and has turned lower even as the index itself rallied in March. A break below 50% would likely signal that the stock market pause is transition into a more meaningful pullback. If that is the case, the S&P 500 could struggle to hold support at the convergence of the 50-day and 200-day averages (near 2750), with the 2650-2600 zone becoming a more likely downside target.
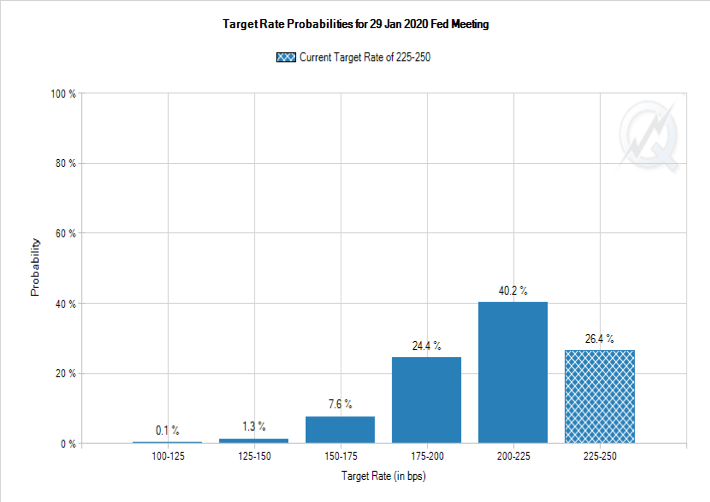
Federal Reserve Policy is Neutral.The Fed backed up its dovish rhetoric with a significant shift in expectations for interest rates. The 50 basis points of tightening in 2019 that was suggested by the December FOMC Dot Plot have been removed in the Dot Plot published after the March 2019 FOMC meeting.
While the Fed forecasts suggest no rate hike in 2019 and only 25 basis points of tightening in 2020, the futures market has begun to aggressively price in interest rate cuts as soon as this year.While the Fed in 2019 has moved toward the market in terms of expectations, there remains a rift that needs to be closed and it may be premature to assume that the rate tightening cycle has runs its course.
Between economic data that has come in below expectations and central bank (both at home and abroad) shifts toward patience and accommodation, bond yields have plummeted in 2019. The yield on the 10-year T-Note has dropped from a late-2018 peak near 3.2% to as low as 2.4% (in the process dropping below the 3-month T-Bill yield). The yield on the 10-year German Bund has moved into negative territory for the first time since 2016.
The drop on yields on government bonds has not been echoed in the corporate or high-yield space, and copper prices have been relatively resilient. Government yields appear to be cuing off of concern from central banks.
continuing reading on the next page…

: Creating Bullish Divergence?")

: Creating Bullish Divergence?")


