At this point, declining bond yields indicate concern about the economy and so may not be a bullish indication for stocks.
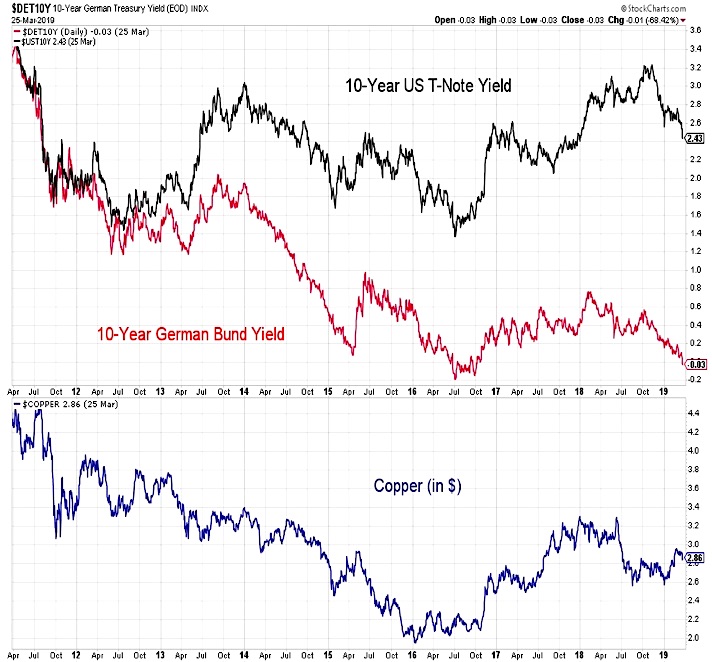
The sharp decline in yields poses an additional risk for the Fed. While the market has interpreted Fed patience as a prelude to rate cuts, patience may also be a prelude to the completion of the rate tightening cycle. If this view quickly becomes the consensus view, a sharp rebound in bond yields could be seen.
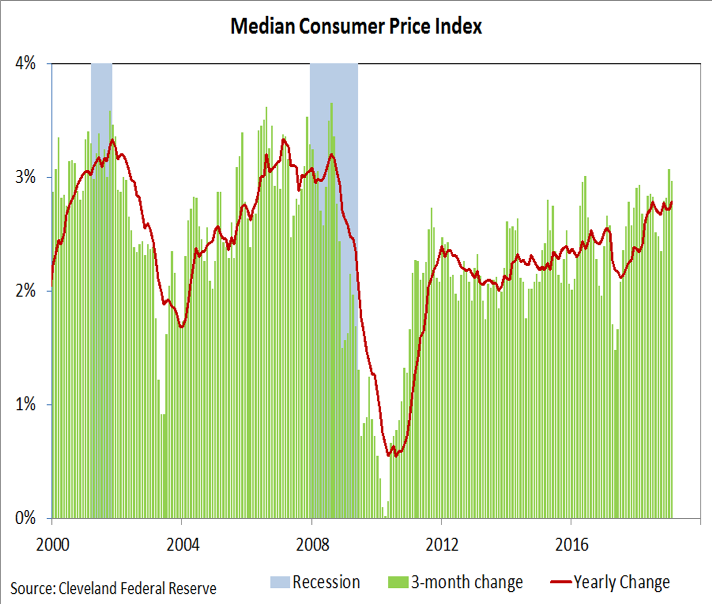
In the current environment the best backdrop for stocks would be a modest uptick in bond yields, with neither a sharp rise nor sustained decline being seen as beneficial.If inflation pressures heat up (and the median CPI is not as benign as some might imagine), that could be a trigger for the market to look for higher interest rates.
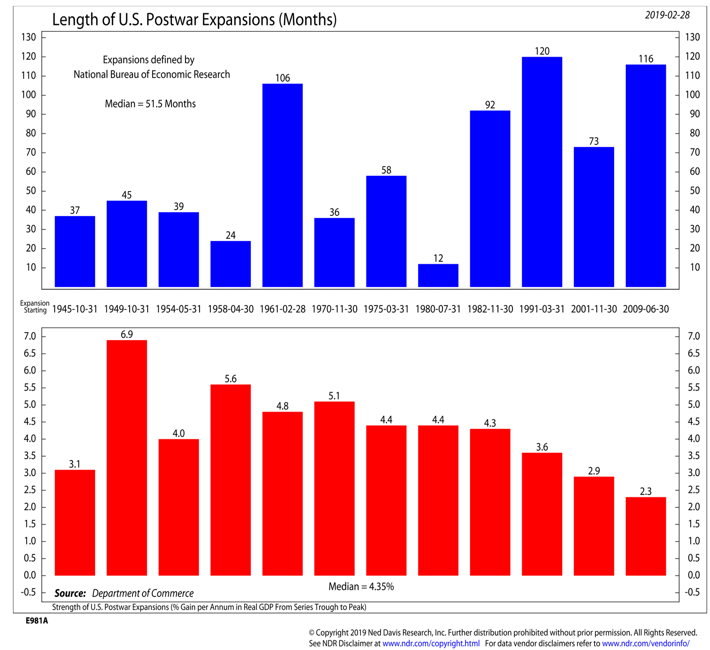
Economic Fundamentals are Bullish.While growth may slow in 2019, this follows 10 consecutive quarters in which yearly GDP growth has accelerated. Near-term recession risk remains minimal, and the current recovery could soon become the longest on record. While historically long, the recovery has also been historically weak in terms of quarterly average real GDP growth. The acceleration in growth seen over the past two-plus years has come off of an admittedly low threshold.
While secular stagnation themes continue to make great headlines, median household incomes have been improving and the trend in productivity growth has turned higher.In other words, while the economic growth experience of the past 10 years may have helped reset expectations lower, improving secular trends may buoy actual growth.
For 2019, the growth outlook may hinge on economic confidence. Animal spirits do not fit neatly into economic models, confidence tends to beget growth. Confidence is retreating but it is too early to tell whether this is a modest retrenchment or the prelude to a larger swoon in confidence.
Recessions tend to be preceded by declining confidence, but not every drop in confidence leads to a recession.In addition to consumer confidence, we are watching small-business optimism (as measured by NFIB) and CEO confidence (as reported by the Conference Board). Further deterioration in these measures would raise risks to the outlook that while growth may moderate in 2019, broad and persistent economic weakness is not likely to be seen this year.
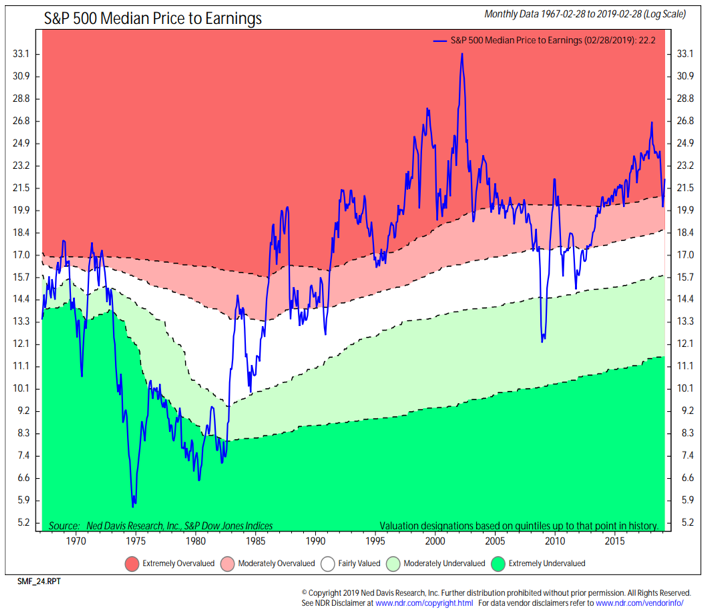
Valuations are Bearish.For a brief moment at the end of 2018, valuations appeared to approach historically reasonable levels. If you blinked you missed it, as earnings weakness and stock market strength pushed valuations higher.
Valuations are not very useful as near-term market signals, but they do a great job of assessing longer-term risks in stocks.When valuations have been elevated, forward returns have been muted and when valuations have been suppressed, forward stock market returns have been more robust. With valuations (as measured by the median P/E ratio for the S&P 500) in the most overvalued quintile, it may be prudent to reduce expectations for stock market returns over the coming decade.
Sentiment is Neutral. The flow of daily and weekly sentiment indicators can be noisy. While we have generally seen optimism return over the course of the first quarter (fund flows have been a notable exception), it has not reached a level of widespread excessiveness that would prompt a change in our evaluation of it. Longer term, however, sentiment poses a headwind for stock market returns.
There is a strong and robust inverse correlation between household exposure to equities and subsequent stock market returns.When equity exposure has been elevated, future returns have been subdued and when equity exposure was reduced (as was the case in early 2009), returns over the ensuing decade have been robust.Even with the decline in equity exposure brought about by last year’s stock market weakness, overall exposure remains in the highest historical quintile.
Seasonal Patterns & Trends are Neutral. The strength in stocks seen over the course of the first quarter of 2019 is not totally surprising. The first quarter of the third year of a president’s term has historically been the second- strongest quarter of the entire presidential election cycle. The caveat is that, historically, the strongest quarter of the entire cycle is Q4 of the mid-term election year (that was Q4 2018).
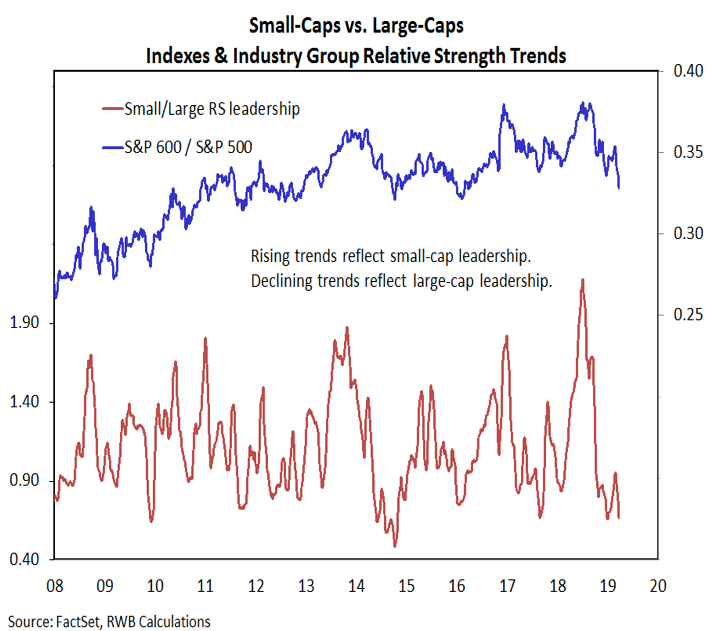
Historical seasonal patterns are being somewhat distorted in the current case, so while considering these tendencies we are also looking for evidence that they are playing out. In past periods of post mid-term election stock market strength, small-caps have led relative to large-caps. The lack of persistent small-cap leadership in the current example has kept us from upgrading Seasonals to Bullish.
Market Breadth is Neutral.We do not want to summarily dismiss the breadth thrusts that emerged as stocks rallied off of the late 2018 lows. The track record for stocks in the wake of such breadth thrusts is impressive, especially when multiple signals are generated. Given the possibility that the improvements in the shorter-tem indicators were a function of late 2018 weakness rather than 2019 strength, we are looking for longer-term trends to improve (or provide positive divergences from price) before upgrading breadth to Bullish.
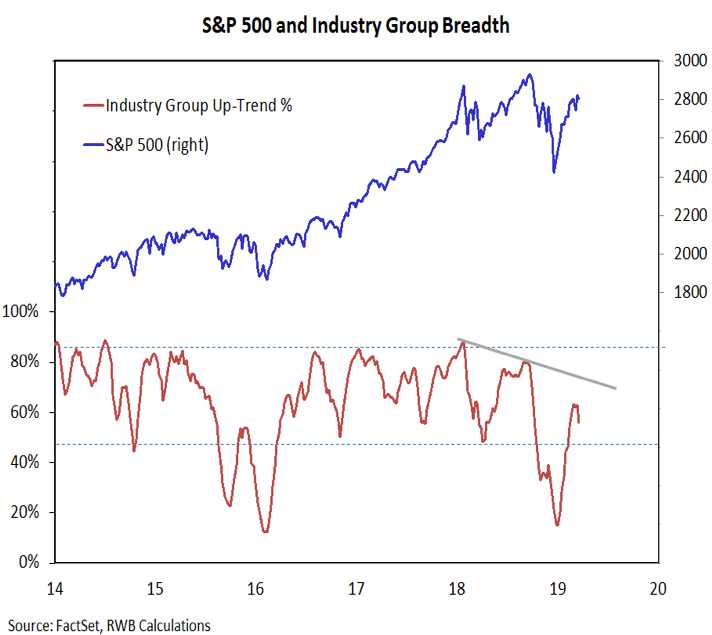
Neither the percentage of S&P 500 stocks above their 200-day averages (discussed above) nor our industry group trend indicator have provided confirmation that the longer-term trend backdrop has met the threshold for upgrade. We are also watching the global stage, where only one in four country-level indexes is in an uptrend.
Twitter: @WillieDelwiche
Any opinions expressed herein are solely those of the author, and do not in any way represent the views or opinions of any other person or entity.


 Ready To Break Out?")