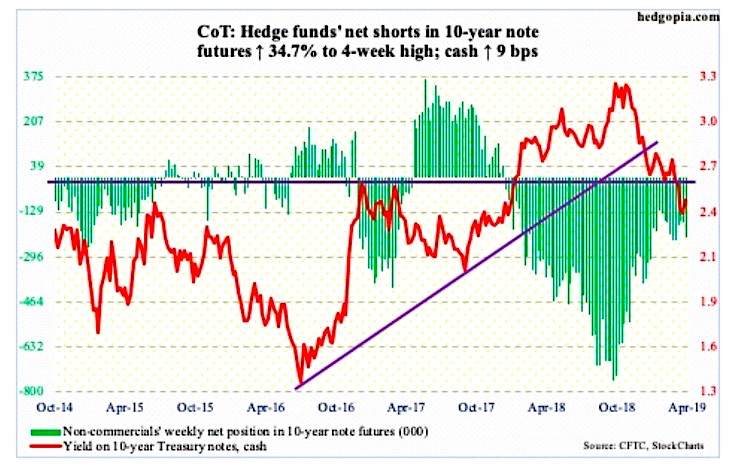
The chart and analysis below looks at non-commercial futures trading positions for the 10 Year US Treasury Note and yield.
For the week, the cash 10 Year Treasury note traded higher by +2.3%.
Here’s a look at 10 Year US Treasury Note futures speculative positioning. Scroll further down for commentary and analysis.
Note that the chart and data that follow highlight non-commercial futures trading positions as of April 2, 2018. This data was released with the April 5, 2019 COT Report (Commitment of Traders).
Note that this chart also appeared on my blog.
The 10 Year Treasury Note has pulled back, allowing yields (and interest rates) to bounce higher. Is this just a bounce, or have yields / rates bottomed. Let’s look at the COT data and technicals to see what’s next.
10-year note: Currently net short 224.2k, up 57.7k.

The 10-year Treasury bond yield sits around 2.5%, after rallying nine basis points last week. Under the right circumstances, yields should rise into 2.62%, which marks a critical level going back 10 years or so. That level was lost in March. The 50-day moving average is around there as well, so this will act as a line in the sand to watch for investors.
Bonds reached the point (based on momentum indicators) where bulls can (and should) make a stand. Following the March’s jobs report (Friday), Treasury bonds created a reversal of sorts. Keep it on your radar. The iShares 20+ year Treasury bond ETF peaked a week and half ago at $126.69. $122.50 is a support zone to watch there.
Twitter: @hedgopia
Author may hold a position in mentioned securities at the time of publication. Any opinions expressed herein are solely those of the author, and do not in any way represent the views or opinions of any other person or entity.


