$XOP Oil and Gas Exploration & Production ETF Bullish Buy Signal
I remain long (bullish) the Oil and Gas Exploration ETF (XOP) and believe that the current pause is a bullish consolidation.
Furthermore, I also believe...
Precious Metals Gold and Silver Trigger Bullish Trading Signals
It looks like the precious metals are gaining some momentum.
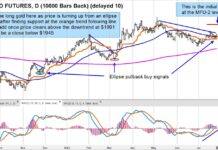
Gold futures put in an ellipse trading buy signal and we see a potential move up...
The Government Can’t Afford Higher Interest Rates For Longer, Much Longer
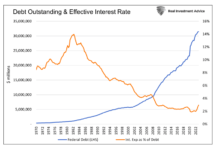
Jerome Powell and his colleagues endlessly reassert their “higher for longer” plan for interest rates. They aim to weaken economic growth, bringing inflation back...
Who Needs Mega-Caps? Blue Chips Q2 Earnings In Focus
The following research was contributed to by Christine Short, VP of Research at Wall Street Horizon.
Sector rotation has been ongoing for the last two...
3 Market Highlights: Netflix, Tesla, and Real Estate Trends
This week we highlight the following market insights:
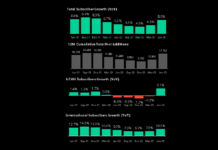
Netflix issues strong report, but average revenue per subscriber left questions. Longer term, the right strategy.
Is Tesla...
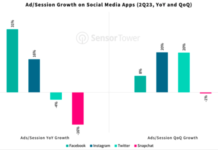
3 Stock Market Datapoints (July 16): Instagram, Ads, and Amazon Prime Day
Looking at the week that was as well as the week ahead, I wanted to share 3 important economic datapoints from corporate america (and...
Is Inflation Permanently “Dissed”?
I wish I could say that the clearly impressive trend from peak until now in CPI and PPI is sustainable.
However, I am more inclined...
US Dollar To See Further Weakness? Gold Bulls Hope So!
After peaking in 2022, the US Dollar Index has spent nearly a year in decline.
But it may be set to fall even further. And...
IPO Market Showing Signs of Life as Wall Street Optimism Grows
The following research was contributed to by Christine Short, VP of Research at Wall Street Horizon.
The last 18 months have been like an ice...
Employment Insights: Labor Market Still Strong
Well, it looks like AI (artificial intelligence) has not replaced everyone’s job just yet. Last week saw a surprisingly strong ADP employment report of 497k –...


