Looking at the week that was as well as the week ahead, I wanted to share 3 important economic datapoints from corporate america (and the market of stocks).
Here they are:
Instagram saw strong engagement growth in Q1, Twitter went negative.
Ad portals saw growth.
Amazon Prime Day top keywords and categories.
INSTAGRAM ONCE AGAIN LEADS ENGAGEMENT IN Q2, +22% Y/Y, TWITTER -5%.
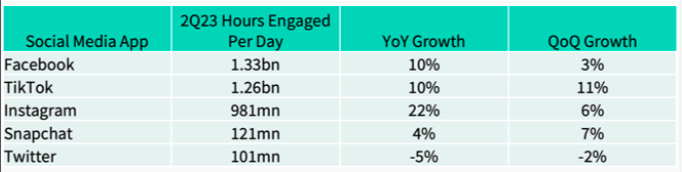
Q2 is over and the data is out. Instagram led social media platforms in growth with a 22% increase in user engagement hours year over year. Twitter struggled, experiencing a 5% decrease. Despite being in the industry longer, Facebook managed a solid 10% growth. TikTok was the same as Facebook. These trends indicate a shift towards visual content platforms and a possible decline in traditional text-based platforms. This makes the launch of Threads interesting.
Disclosure: My company (Avery) is an investor in $META (Instagram, Facebook, etc) at the time of this article.
GROWTH TO FACEBOOK/INSTAGRAM PLATFORMS SUGGEST ADS ARE BACK.
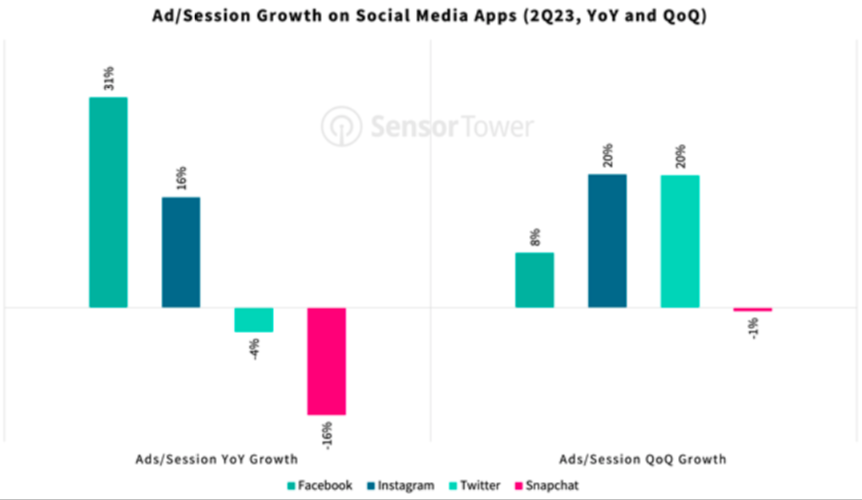
Advertiser interaction with the ad portals of social platforms is on an upward trend. We are seeing growth both year over year and quarter over quarter. Facebook has not only demonstrated robust user engagement, as previously highlighted, but also marked an increase in sessions on its ad portal. Monitoring these ad portals is crucial because they serve as the launchpads for advertisers’ campaigns. Facebook registered significant growth of 31%, whereas Snapchat and Twitter experienced year-over-year downturns.
TOP KEYWORDS FOR AMAZON PRIME DAY, A RECORD SALES DAY.
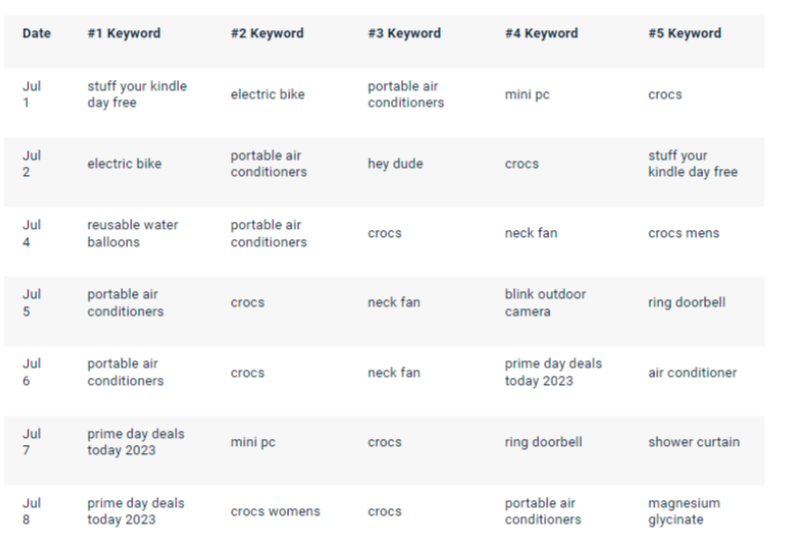
One of the biggest shopping days of the year just occurred. Looking at sales data for Amazon Prime Day suggests that US consumers spent $6.4B on the first day, a 6% increase.
Adobe Analytics reports that the sales momentum was fueled by a handful of distinct categories. Appliances led the way with an impressive 37% surge compared to the average daily sales of June. Toy sales climbed 27%, and closely following were apparel sales which increased by 26%. In addition, electronics also displayed a significant uplift with a 12% increase in sales. These sales trends align well with the prevalent search keywords during the same period.
This is not a recommendation to purchase or sell any securities mentioned. This is for educational purposes only.
Twitter: @_SeanDavid
The author or his firm may have positions in the mentioned companies and underlying securities at the time of publication. This is not a recommendation to buy or sell securities. Any opinions expressed herein are solely those of the author, and do not in any way represent the views or opinions of any other person or entity.

: Worrisome to Broader Market?")

