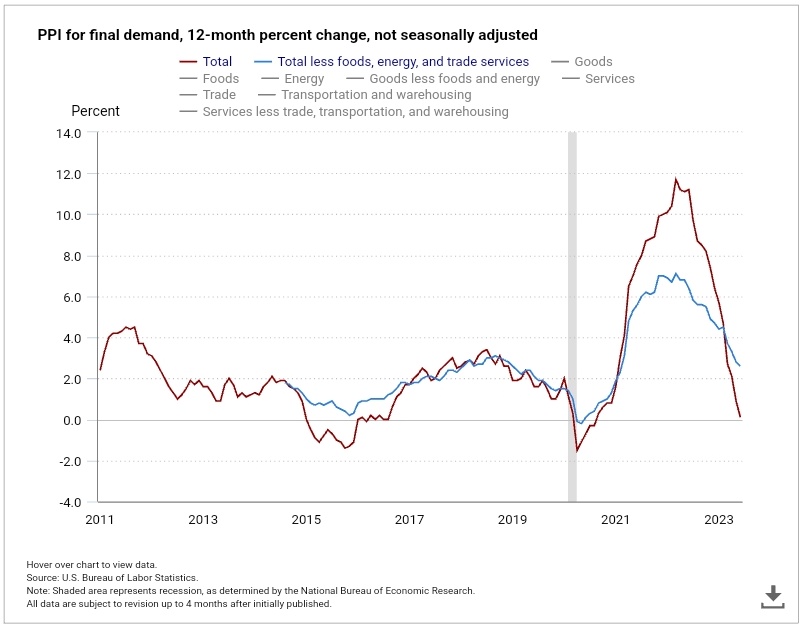
I wish I could say that the clearly impressive trend from peak until now in CPI and PPI is sustainable.
However, I am more inclined to say “trough” with more chance of rising inflation numbers going forward rather than the chance of inflation falling further.
Here are some of the top reasons why:
- Wage increase in the UK-highest rate since records began in 2001.
- Canada-inflation expected until 2025 because of higher demand, upward revision to housing prices, and higher imported goods prices.
- Geopolitics-Russia China North Korea Israel- Jeffrey Sachs says that geopolitical risks are the biggest threat to companies’ bottom lines. He also says that China and the US are straining supply chain.
- Weather issues El Nino-Gulf of Mexico temps soared-highest on record for this time of year. Headline in the WP- Flooding, extreme heat waves, and hot oceans will continue — and get worse.
- Supply chain strikes-potash shortages due to Port of Vancouver strike
- Grain prices-Will Russia extend the UN brokered deal to allow flow of grain from Ukraine? Food exports are dwindling esp. to the poorest nations.
- Gold and silver-time to watch the ratio between the two precious metals and the relationship between SPY and GLD
- Cocoa at 14-year highs, Rice-highest price in 2-years due to drought in China and a hold back of exports from India
- Crude oil-SRP at lowest levels since 1983-leaving little room for the US to increase supply if prices continue to ascend.
We like to let the charts be our guide. Here are a few relevant ones.
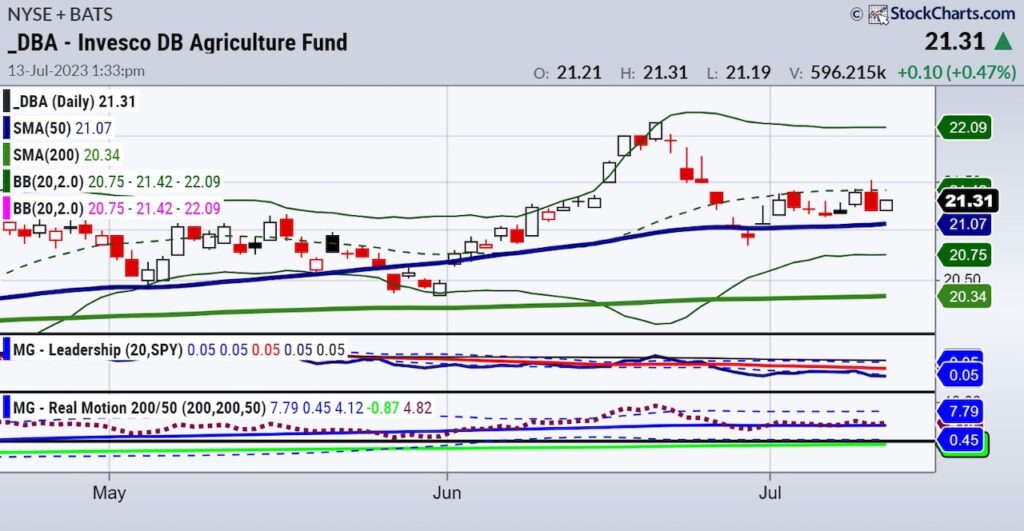
DBA the ETF for many grain and soft commodities. In a bullish phase, underperforming the SPY and momentum flat-at this point, not flashing any major concerns as a whole ETF basket. But not to be ignored either.
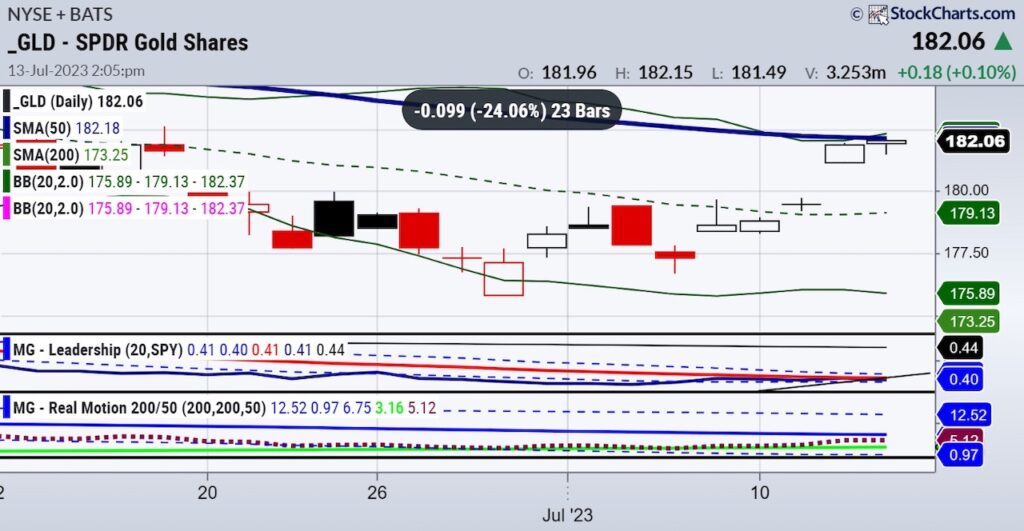
GLD ETF. Testing a potential return to a bullish phase if clears the 50-DMA. On par in performance or leadership with the SPY. Momentum is in a bit of a bearish divergence versus price. Should GLD start to outperform SPY, first real sign of risk off and potential spike in inflation.
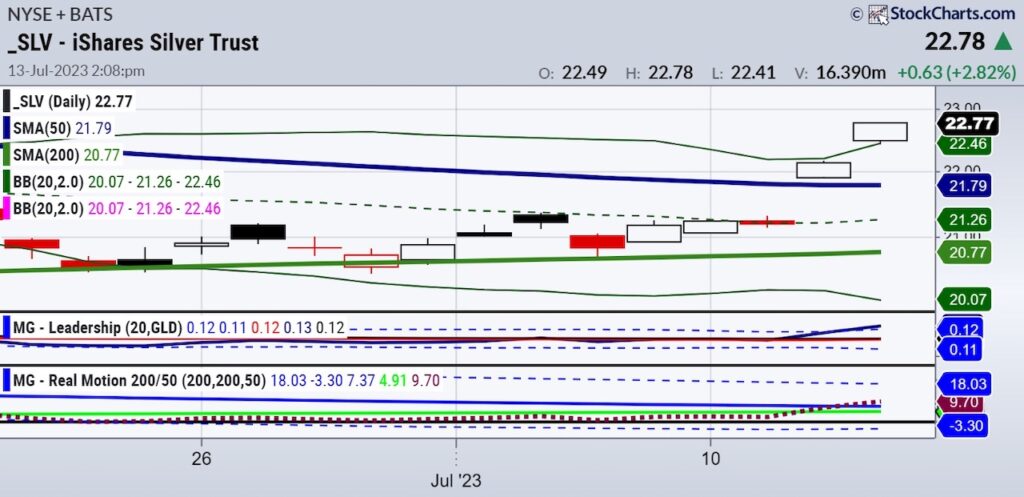
Silver and Silver to Gold Ratio. Most interesting and alarming of the 3 charts. Price confirms SLV is back in a bull phase. And the Leadership clearly shows SLV outperforming GLD, which if sustains, is a huge warning of inflationary factors ahead. Momentum in our Real Motion indicator is also in a bull phase, with momentum on the rise.
We love a good re-set. Next week the July 6-month calendar range will do just that. We will have a range to look at-which after this month’s moves thus far, should be really interesting to see.
Which instruments will break out or down, and which will stay trading between the top and bottom of the range.
Twitter: @marketminute
The author may have a position in mentioned securities at the time of publication. Any opinions expressed herein are solely those of the author and do not represent the views or opinions of any other person or entity.

: Worrisome to Broader Market?")

