Gold Miners ETF Breaking Out of Bullish Falling Wedge Pattern!
The precious metals complex may be ending a 2 month pullback / consolidation pattern.
And perhaps in grand fashion!
With Gold and Silver prices bouncing off...
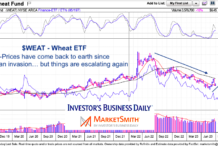
$WEAT Wheat ETF (and inflation) Down But Not Out As Ukraine War Escalates
Investors and economists are getting awfully complacent about inflation, in my opinion. They seem to think that an escalating international war that we are...
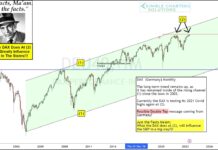
Is German DAX Holding The Key To Global Stock Markets?
A recent review of global stock market indices put a major European index on my radar: The German DAX.
The current price pattern for the...
4 Market Trends To Follow This Summer
This week we share 4 charts depicting market trends into summertime... because we could not stop at 3.
Zoom sees record in-app monthly revenue...
Apparel retail foot...
Transports (IYT) Nearing Short-Term Breakout Resistance
It's been a rough go for the Transportation Sector ETF (IYT) ever since COVID. And to be fair, it's understandable as tourism and vacationing...
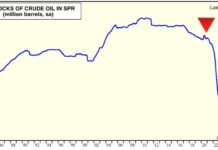
U.S. Oil Reserves Drop to 40 Year Lows
On June 12th, Goldman Sachs came out stating how bearish they are on oil.
I wrote a Daily about it on June 20th:
Bearish at the Bottom-Institutions...
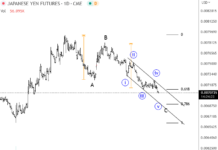
Is Japanese Yen Weakness Coming To An End? (Elliott Wave Analysis)
The weakness of Japanese Yen may be coming to an end, as we see it nearing key Fibonacci price support... and when the Federal...
Complete Trader: Macro to Micro and Top Picks Live
Once a month, I do a coaching session for our members of the Complete Trader, a MarketGauge comprehensive product for the discretionary trader.
During the 45-minute...
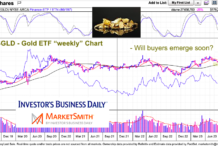
Gold Trading “Refresh” Nearing The Buy Zone?
Gold prices took a 3rd run at new highs and fizzled out again. Looks like it may take a 4th attempt.
Earlier this month, I...
Is Cannabis ETF (MSOS) Finally Low Enough to Go High?
Wednesday, we began to see a separation between what Chairman of the Fed Powell said on fighting inflation, and the inflation indicators themselves.
Food commodities,...


