The precious metals complex may be ending a 2 month pullback / consolidation pattern.
And perhaps in grand fashion!
With Gold and Silver prices bouncing off key price support, we are seeing similar action in the Gold Mining stocks.
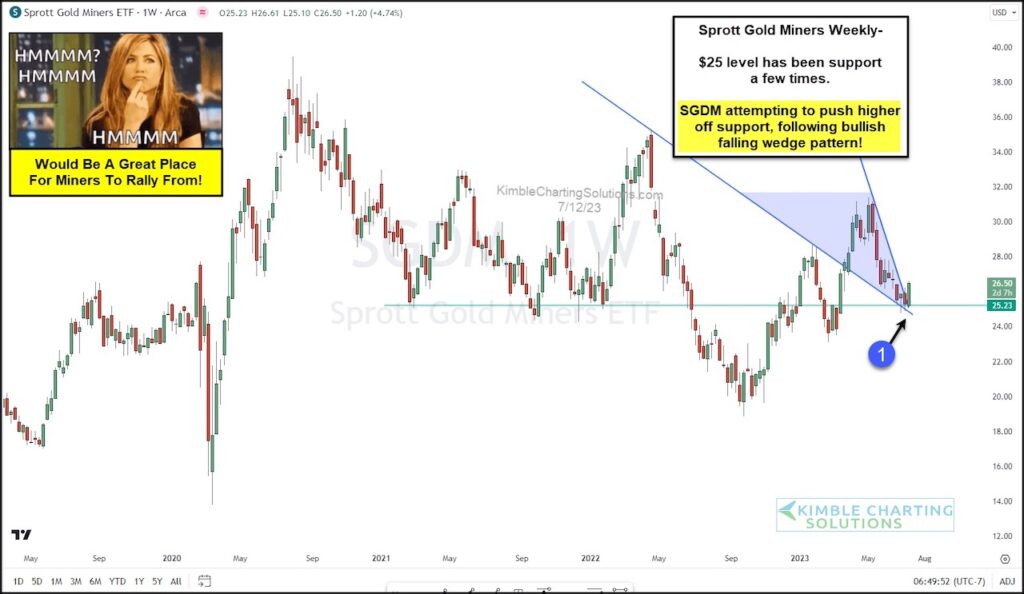
Today, we look at a “weekly” chart of the Sprott Gold Miners ETF (SGDM) to highlight the potential of the current precious metals rally.
As you can see, SGDM formed a bullish falling wedge pattern into important horizontal price support. And more importantly, it is now breaking out of that pattern to the upside with a big weekly candle.
$25 has marked important price support/resistance over the past couple of years. As long as that holds, this could be a great opportunity for bulls to push prices higher. Stay tuned!
$SGDM Sprott Gold Miners ETF “weekly” Chart
Note that KimbleCharting is offering a 2 week Free trial to See It Market readers. Just send me an email to services@kimblechartingsolutions.com for details to get set up.
Twitter: @KimbleCharting
Any opinions expressed herein are solely those of the author, and do not in any way represent the views or opinions of any other person or entity.
Editor’s Note (8/13/23 10:42 am CST): Corrected symbol and name to SGDM Sprott Gold Miners ETF.

 and Semiconductors (SMH): Concerning Price Pattern?")

 and Semiconductors (SMH): Concerning Price Pattern?")


