It’s been a rough go for the Transportation Sector ETF (IYT) ever since COVID. And to be fair, it’s understandable as tourism and vacationing (and business travel) all slowed.
But the past 18 months have seen the industry make a comeback, especially the past couple of months (as seen on today’s chart).
The big question now is whether or not the Transportation Sector (IYT) can become a stock market leader. The sector is well off it’s all-time highs, but it is facing an important test of resistance. And a move above this resistance would be a first step toward turning bullish.
Note that the following MarketSmith charts are built with Investors Business Daily’s product suite.
I am an Investors Business Daily (IBD) partner and promote the use of their products. The entire platform offers a good mix of tools, education, and technical and fundamental data.
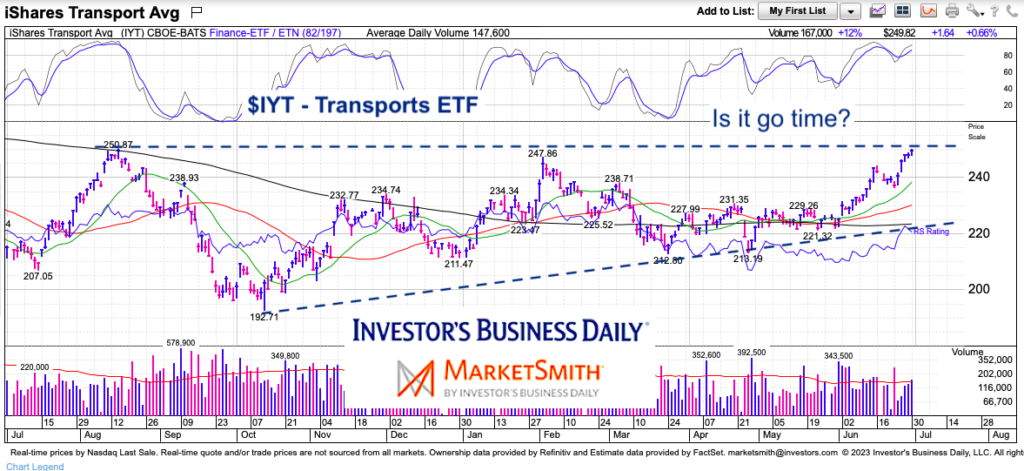
$IYT Transportation Sector ETF Chart
Today’s chart is pretty simple. We can see a rising base and strong overhead resistance at $250. This level has marked resistance for almost a year, so a breakout over this level (and holding above it) would open up a move to $260 to $280 and a retest of all-time highs.
More important, it would structurally eliminate a psychological resistance point and give bulls confidence buying pullbacks / corrections.
Twitter: @andrewnyquist
The author may have a position in mentioned securities at the time of publication. Any opinions expressed herein are solely those of the author, and do not in any way represent the views or opinions of any other person or entity.
")

 Testing Important Price Support")
")
