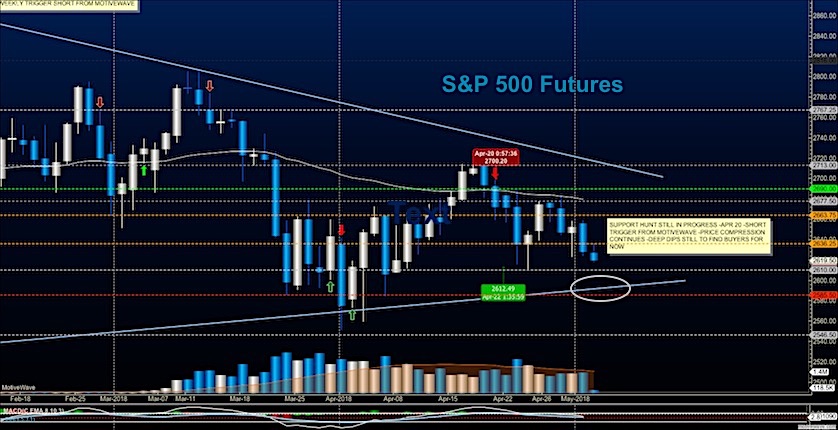
S&P 500 Futures Trading Outlook For May 3
Broad Stock Market Futures Outlook for May 3, 2018
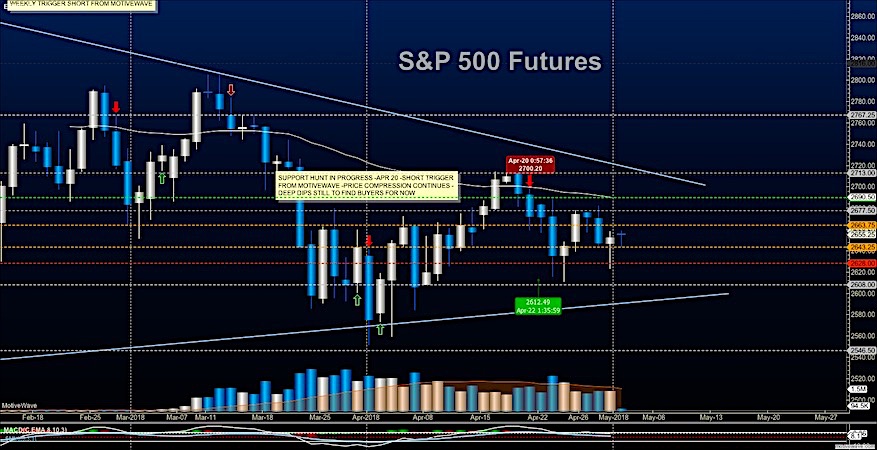
Edges tested repeatedly are likely to break and we are seeing this today. Deeper dips will find buyers...
S&P 500 Trading Update: A Fugly Fed Day
S&P 500 Trading Outlook (1-2 Days): Bearish
The rally that began yesterday hit price resistance at 2665-70 before turning back lower.
At present, there are insufficient signs...
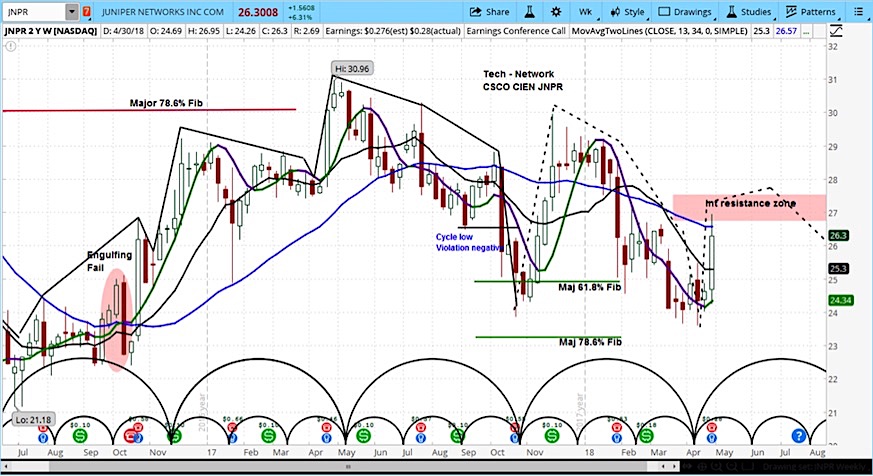
Juniper (JNPR) Jumps On Earnings, But Stock Outlook Bearish
Juniper Networks (JNPR) traded 6% higher on Wednesday morning, after reporting earnings that beat Wall Street expectations.
The company reported earnings per share of $0.28...
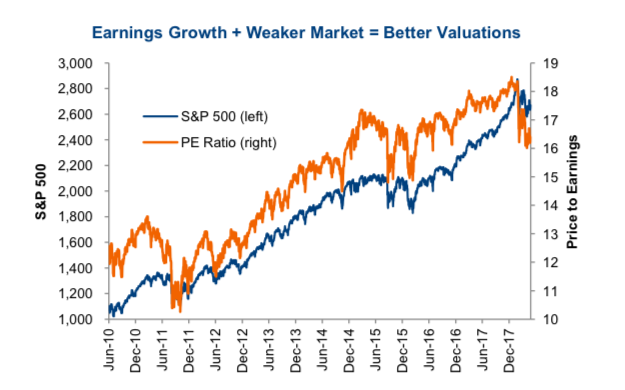
Corporate Earnings: Direction of Margins Often Leads Market
Corporate earnings season for the U.S. market has passed the half way point with over 260 of the S&P 500 constituents having reported and...
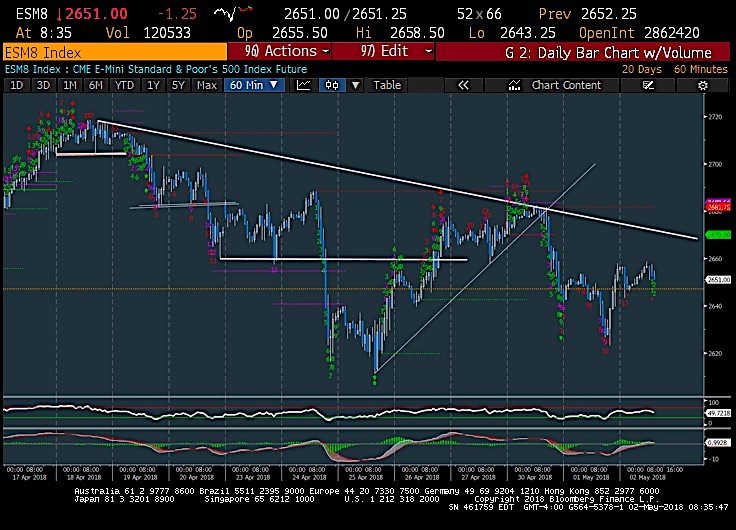
S&P 500 Futures Update: Bulls Get A Kick Save
Broad Stock Market Futures Outlook for May 2, 2018
The edges of the wedges were tested and held yesterday and this morning we are at lower highs...
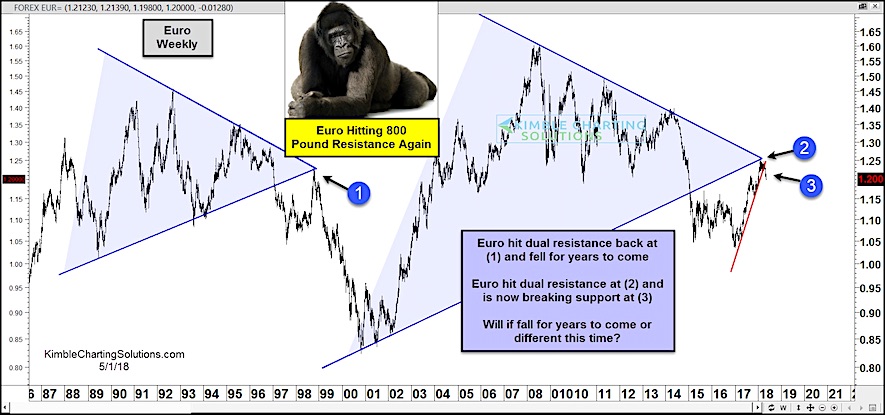
20 Years Later… It’s Deja Vu for the Euro!
From early 2017 to 2018, the Euro Currency rocketed higher by more than 20 percent.
And, you guessed it, the U.S. Dollar took it on...
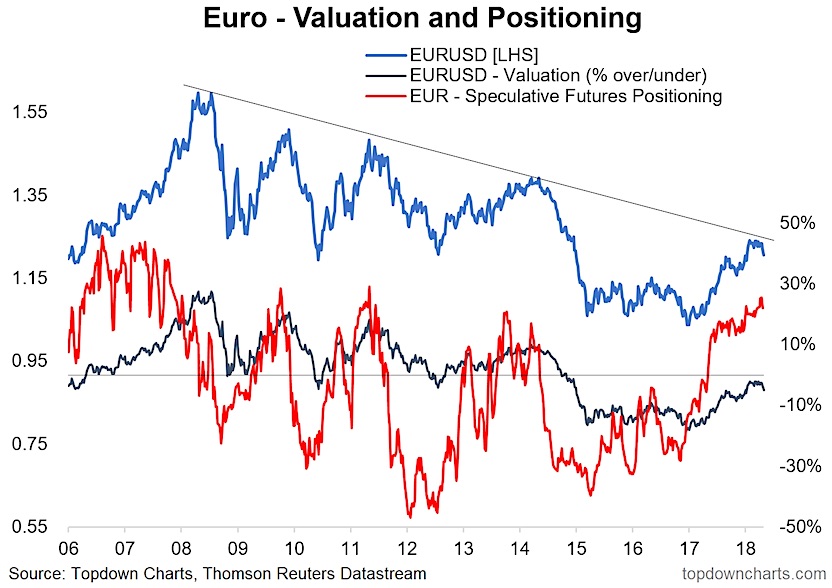
EURUSD: From Good Buy to Goodbye
The market is finally starting to wake up after a dream run for the Euro.
Speaking to the title, about this time last year I...
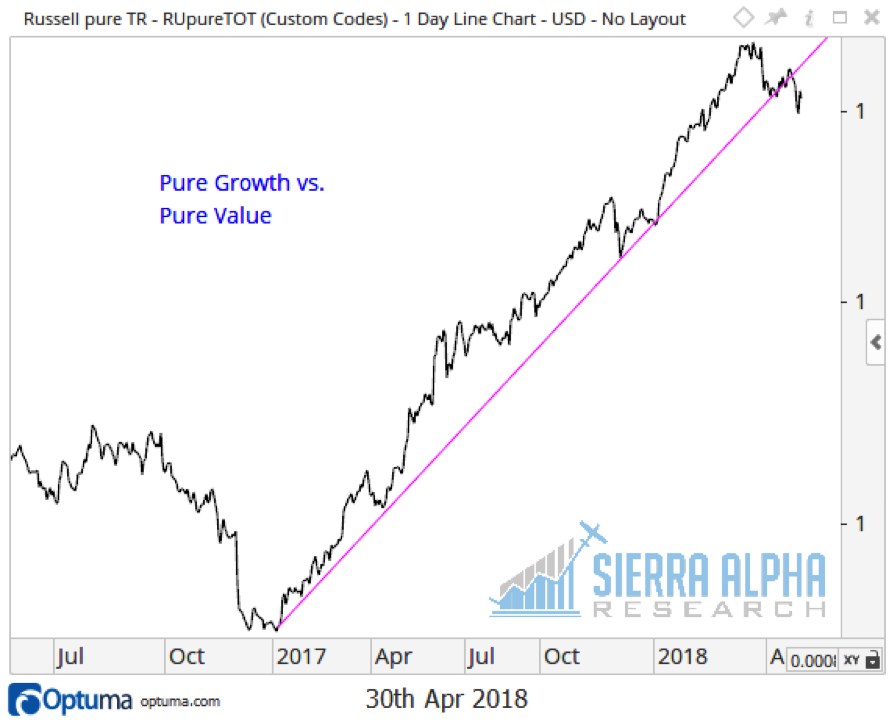
The Return Of Value… Can It Be True?
I was intrigued to see both Barron’s and the Wall Street Journal touting the “return of value” in recent days.
More interesting than the headlines...
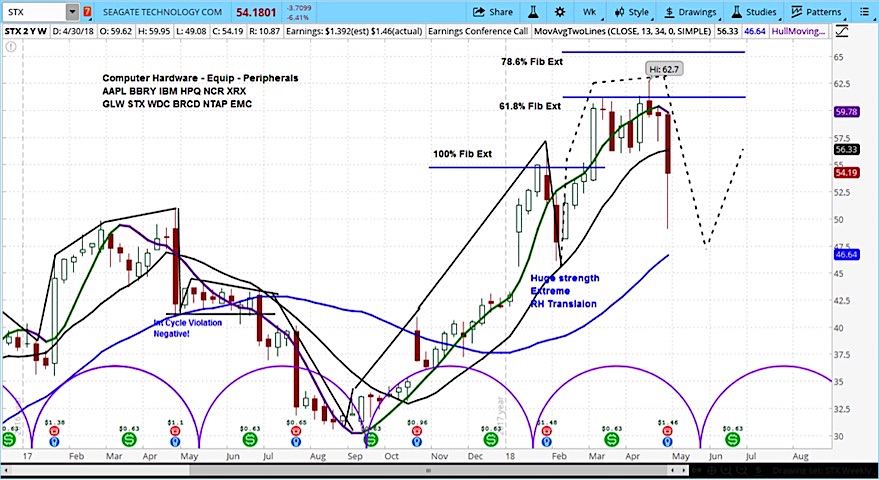
Seagate (STX) Earnings Beat, But Stock Heads Lower
Seagate Technologies (STX) traded 6% higher on Tuesday morning, after reporting earnings that beat Wall Street expectations.
The company reported earnings per share of $1.46...
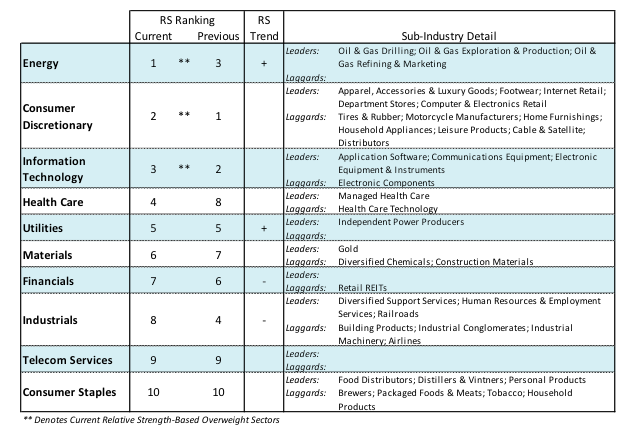
U.S. Equities Update: Rising Interest Rates Spur Volatility
Volatility continues to dog the equity markets as investors turn the page to a new month (May).
Nearly 80% of the S&P 500 companies have...

