From early 2017 to 2018, the Euro Currency rocketed higher by more than 20 percent.
And, you guessed it, the U.S. Dollar took it on the chin.
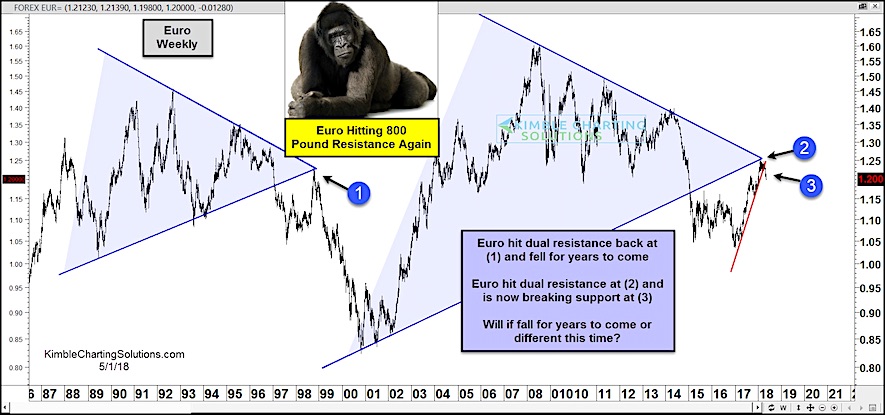
But if history is any guide, this rally may be in the midst of a “turn” lower!
Looking at the chart below, you can see blue-shaded triangle patterns that both resolved to the downside (one in the 1990’s and another in the 2000’s). In both cases, the Euro came back to “kiss” the underside resistance of the triangle at points (1) and (2).
In the 1990’s, that kiss occurred just before another turn sharply lower. Could that be occurring again? Will point (3) mark a moment of historical deja vu?
One concern is that the sharp uptrend line (marked in red) off the January 2017 lows has been broken. This should see more selling to come… but how much?
Will it fall sharply for a couple years… or is it different this time?
Euro Currency “Weekly” Chart
Note that KimbleCharting is offering a 30 day Free trial to See It Market readers. Just send me an email to services@kimblechartingsolutions.com for details to get set up.
Twitter: @KimbleCharting
Any opinions expressed herein are solely those of the author, and do not in any way represent the views or opinions of any other person or entity.


