Volatility continues to dog the equity markets as investors turn the page to a new month (May).
Nearly 80% of the S&P 500 companies have reported better-than-expected bottom-line results. This is considerably above the historic average of 65%. But is not surprising that stocks have fallen after strong earnings announcements given that much of the good news is already built into current prices.
Additionally, with inflation picking up, investors can get a 2.0% yield on the six-month T-bill and 2.5% on the two-year Treasury note representing a bit of competition for the equity markets.
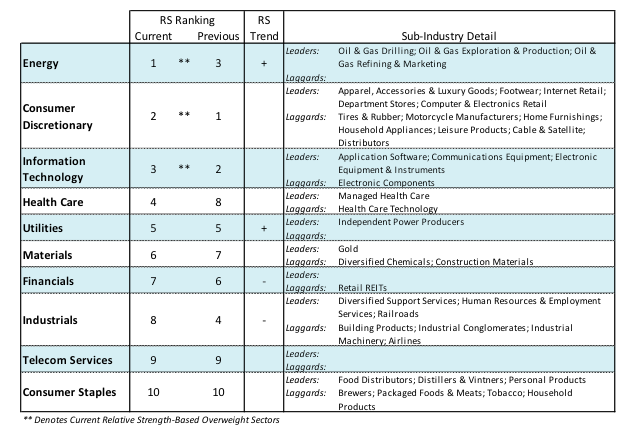
There is also a nagging concern that interest rates will rise too far and too fast which could take a toll on stocks and the economy. Since the 2008 recession, investors have been concerned about the prospects for deflation. The fact that the energy and materials sectors are outperforming is an important indication that the global expansion is on firm footing and sustainable.
Another concern surrounds the performance of the yield curve. The markets sold off recently when the spread between the two-year and 10-year Treasury note fell to 41 basis points, the lowest since 2005. But according to Ned Davis Research, the normal range between the 10-year and two-year Treasury yield curve is between 0 and 1.5% which is also the sweet spot historically for stock market returns. Investors should focus on those areas showing the strongest relative strength including energy, consumer discretionary and technology.
The technical indicators are mixed supporting the prospects for a continuation of the current trading range. Using the S&P 500 Index, support is seen at 2625 and resistance at 2750. The largest concern is that the equity markets are struggling with a lack of upside momentum. Since the January-February correction there have been six instances where downside volume exceeded upside volume by a ratio of 9-to-1 or more. To break out of the current trading pattern we would likely need to see two sessions where upside volume exceeds downside volume by a ratio of 9-to-1 or more.
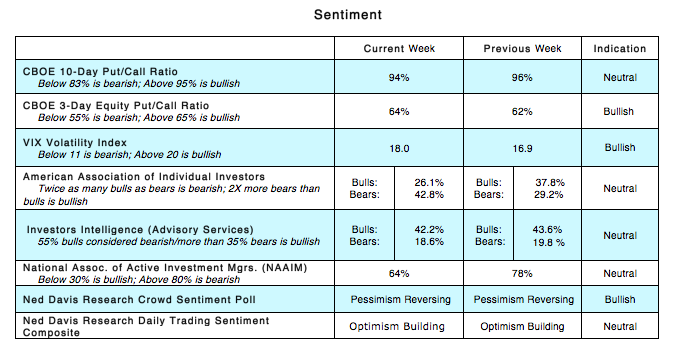
The strongest rallies this cycle have occurred when investors became extremely pessimistic. From a contrary opinion perspective, we are encouraged by the fact that investors have been moving out of stock funds in a substantial way. According to the Investment Company Institute, investors pulled more than $60 billion out of equity mutual funds and ETFs since February. The report also shows investors pulled $2.3 billion out of equity funds for the week ending April 18.
Another bullish signal is that companies are buying back their own stock aggressively. Corporate share repurchases were up 34% in the first quarter over the fourth quarter and up 43% for first quarter in 2017. This is important given that company buybacks have represented the most important source of demand for stocks since 2009. However, we will need to see momentum return to the upside to suggest the correction/consolidation phase has run its course.
Thanks for reading.
Twitter: @WillieDelwiche
Any opinions expressed herein are solely those of the author, and do not in any way represent the views or opinions of any other person or entity.
")


 Ready To Break Out?")
")

