Corporate earnings season for the U.S. market has passed the half way point with over 260 of the S&P 500 constituents having reported and results have been stupendous. ‘MERICA‘!!! Tax cuts, improving global economic growth and a weaker U.S. dollar have all helped drive corporate earnings results to the upside.
So far, 93% of individual companies reported positive sales growth compared to the first quarter of 2017 and 88% have had positive earnings growth as well.
Those are the highest levels of growth since 2009/2010. Keep in mind in 2009/2010 the economy was coming out of the last recession, making comparables really easy to beat (1st chart). Today is completely different, this strong earnings growth is coming at time of record upon record earnings.
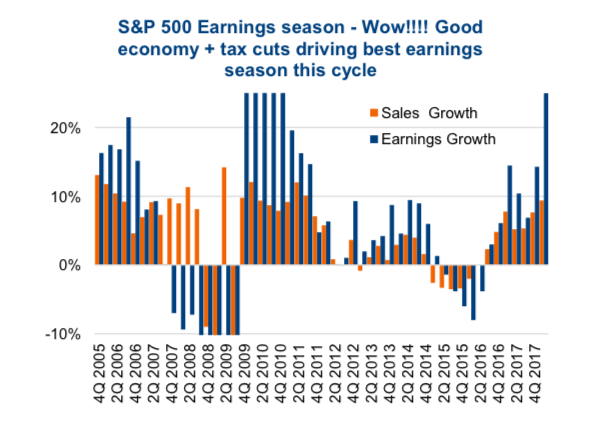
The S&P 500 is on track for about $130 of earnings per index unit over the last four quarters, in 2010 this was closer to $60. Add to the good news, the ratio of positive to negative analyst earnings revisions has been greater than one for the past seven months. That means there has been more upward revisions than downward.
Continued corporate earnings growth combined with a rather tepid market reaction to the earnings season is helping valuations come down (chart below). The S&P 500 is still off its all-time high, sitting at 2,672 compared to a high in January of 2,872.
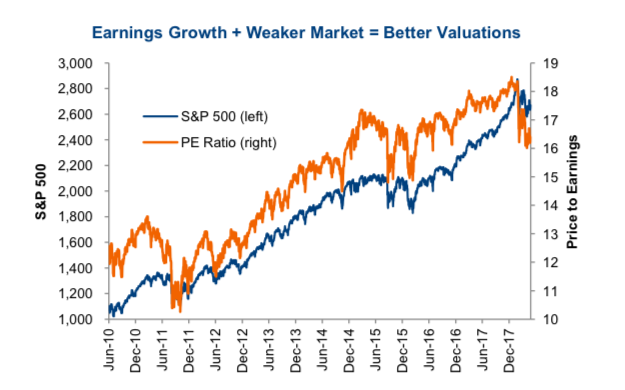
Yet, the price-to-earnings ratio has fallen from 18.4 at the market high to 16.4. This is about the cheapest the U.S. equity market has been since late 2015 or early 2016. To add a little Canadian content, the TSX is even cheaper. The price-to-earnings for the TSX has been declining from 17.5 in mid-2016 to a relatively appealing 14.9x today.
Why have good company earnings not lifted the market higher?
There are probably a few factors mitigating the positive impact of this stellar earnings season. Tax cuts, which are good for corporate earnings, were likely partially baked into the share prices in 2017. After all, this was one of the contributing factors to the great stock gains of last year and the markets tend to move on new information or surprises, not something that has already been legislated. Rising bond yields have also been weighing on markets, with the U.S. ten- year touching 3.0% this past week. If you believe in the school of thought any investment is valued at its estimated future cash flows, discounted back to the present value, higher yields beget a higher discount rate. Presto, lower valuations.
Another reason may be that earnings, much like GDP, are by their nature backward looking. U.S. Q1 GDP was just released at 2.3% annualized. This covers the period from January 1st to March 31st. While insightful, it is really about recent history, not necessarily what is coming next. Same with earnings for Q1, telling you more about how a company did than how a company will do in the future. Plus, there have been numerous past cycles that had earnings continuing to grow well into a bear market. So, while we all welcome strong earnings results and improving valuations, it does little to tell you what is next.
Watch Margins
One fly in the soup this earnings season may be margins. We sliced it a few ways using gross, net and operating margins and found some interesting and mildly troubling results. Focusing on operating margins, which are not influenced by tax rates. We compared margins in this latest quarter to those a year ago. For those who are not armchair accountants, operating margins are calculated by taking a company’s sales less cost of goods sold and selling, general and administrative expenses (SG&A), then dividing by sales. If you made it this far, keep reading, we promise it will get better and more interesting.
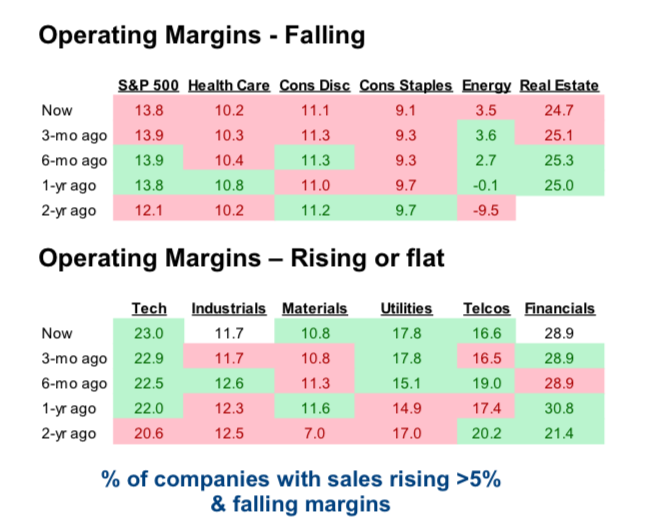
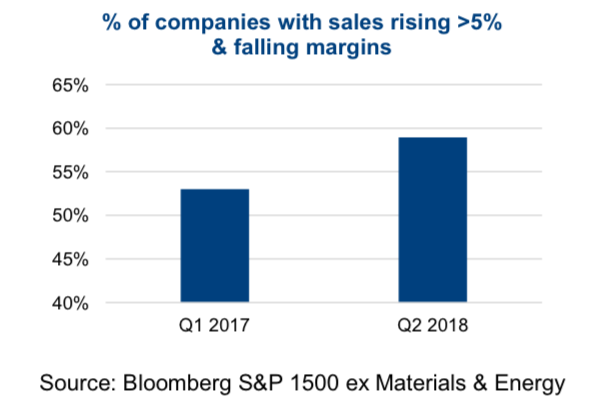
The good news is there is broadening growth, which we would expect given many of the previous comments on this earnings season (GDP, weak USD, etc). We excluded Energy and Materials as they are more influenced by changing commodity prices. 76% of companies in the S&P 1500 (ex Energy and Materials) had positive sales growth in Q1 last year and this year it rose to 82%. Yay! Also, companies with greater than 5% sales growth rose from 53% to 59%. BUT, the number of companies that are experiencing sales growth yet falling margins is on the rise.
You may be thinking, ‘who cares’. Well normally rising sales results in improving margins as the fixed costs for a company are spread over a larger revenue base. For sales to be growing and margin compressing, costs of goods sold and Selling, general and administrative expenses (SG&A) costs are increasing faster than sales. This is often in the form of hiring more staff, which tends to be more expensive when unemployment rates are low, and increasing capacity. This behavior is positive for the overall economy and as long as sales continue to grow, it isn’t a huge concern. However, should sales growth diminish or the cost of adding capacity become too expensive, CFOs will begin adjusting behaviour. Cutting back on hiring and expansion, which can quickly create a negative feedback loop into the economy.
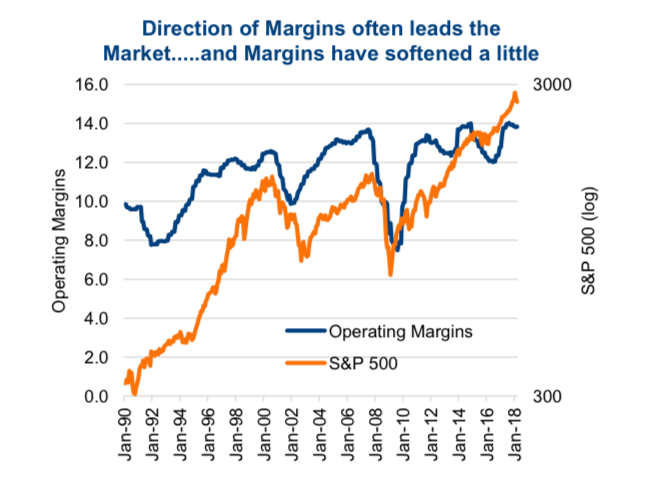
Investment Implications – Margins this cycle may have already peaked and their future path in coming quarters will have an impact on the overall market. Changes in the direction of operating margins, both up or down, have often preceded or been coincidental to changes in the direction of the market. So far, margins have only softened a little (last chart), but the next few data points may be critical for the markets future direction.
Charts are sourced to Bloomberg unless otherwise noted.
Twitter: @sobata416 @ConnectedWealth
Any opinions expressed herein are solely those of the authors, and do not in any way represent the views or opinions of any other person or entity.

 Testing Important Price Support")
: Cup (and Maybe Handle) Watch")

