Interface (TILE): Strong Combination of Fundamentals and Technicals
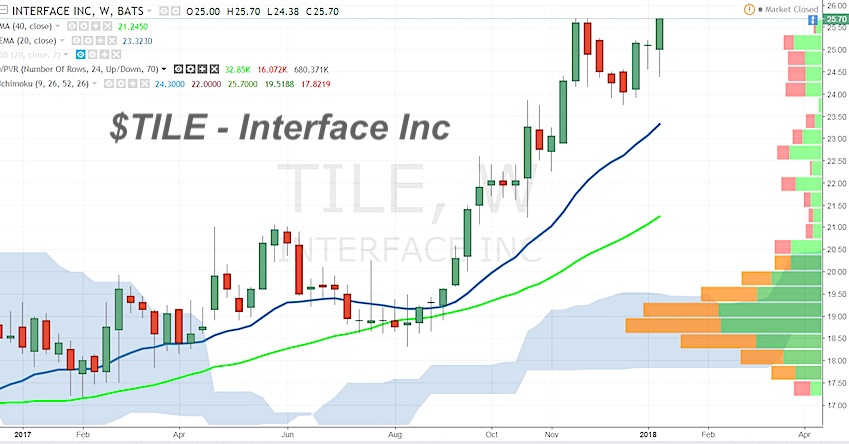
Interface Inc (TILE)
Interface is a $1.54B maker of modular carpet for commercial and residential markets trading 19X Earnings, 1.59X Sales and 41.83X FCF with...
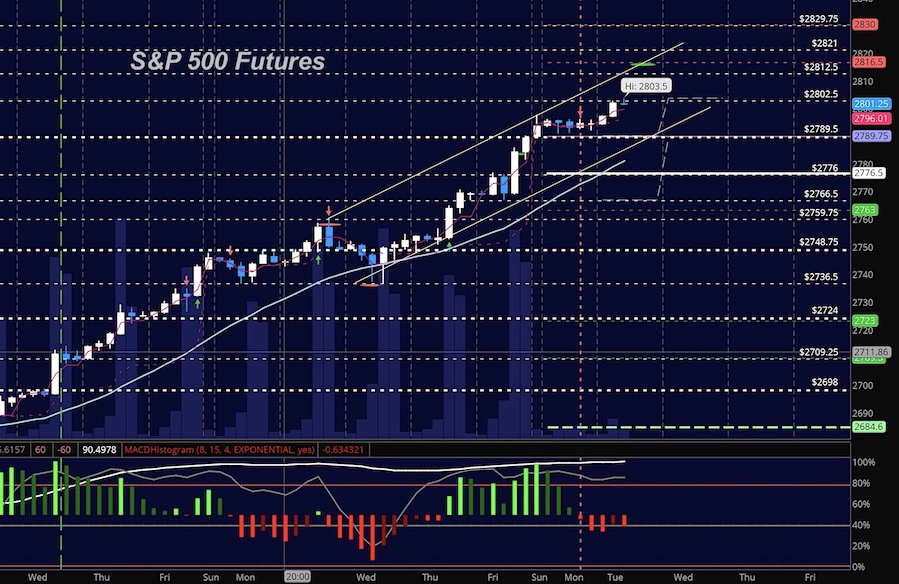
Stock Market Futures Trading Update: Watch Those Divergences!
Market Outlook for January 16, 2018
The S&P 500 and broad market indices are seeing some bullish continuation after the long holiday weekend. However, there is...
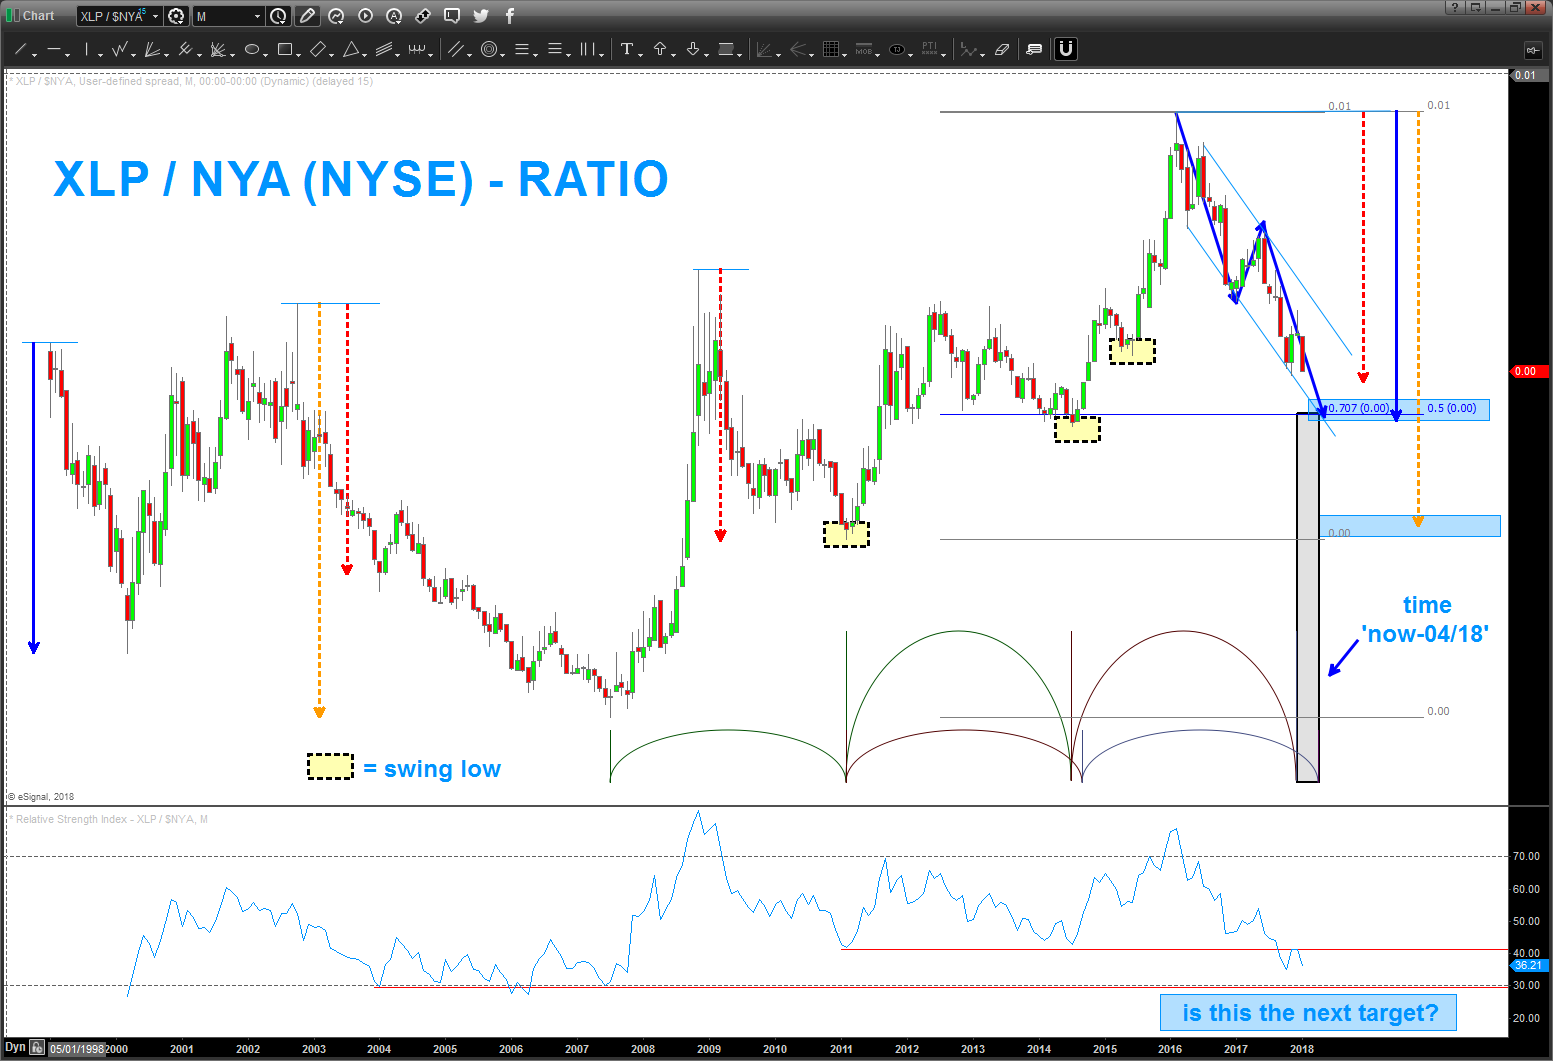
Market Update: Consumer Staples (XLP) / NYSE Composite Ratio
The last time we blogged about this important ratio, we highlighted an important juncture for the market's next move.
While the targeted price level did...
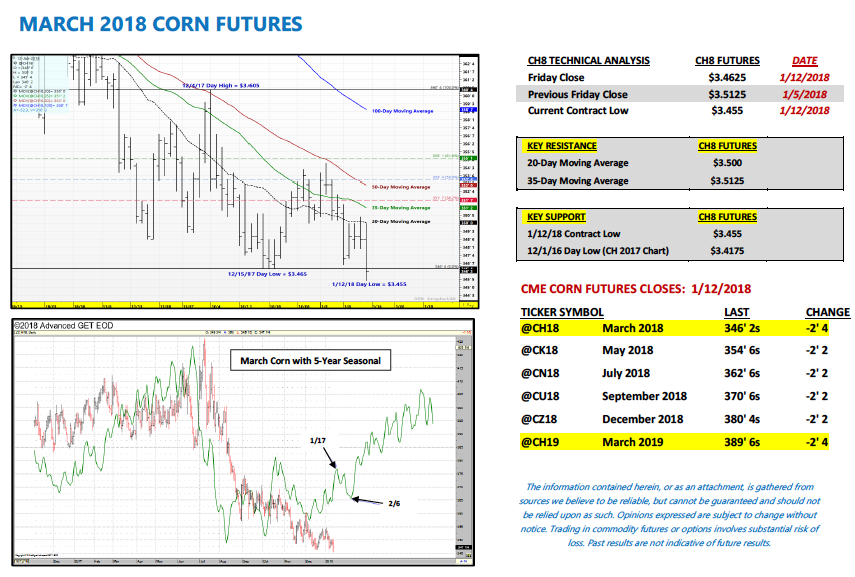
U.S. Corn Futures Weekly Outlook: 4 Concerns For Bulls
MARCH corn futures closed DOWN 5-CENTS per bushel week-on-week, finishing at $3.46 ¼. The price action continues to frustrate corn bulls.
Will this grinding, painful...
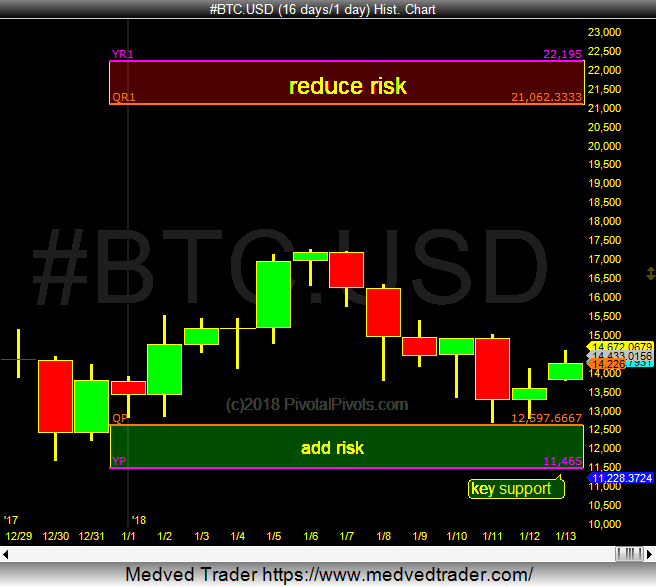
Bitcoin Trading Outlook For 2018: Yearly Pivot Points
2017 was a breakout year for Cryptocurrency. Bitcoin, Ethereum, Litecoin and others rocketed higher as the message spread.
Will the trend continue in 2018?
Today we'll...
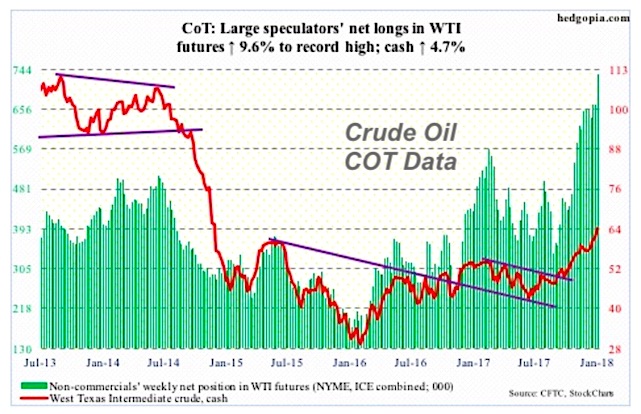
Crude Oil: Large Speculators Most Net Long Ever
The following chart and data highlight non-commercial commodity futures trading positions as of January 9, 2017.
This data was released with the January 12 COT...
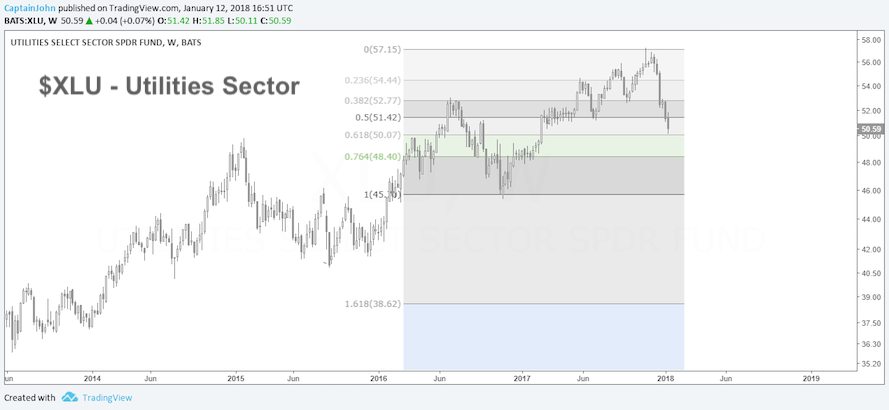
Utilities Sector ETF (XLU) Looks Ready To Bounce
The Utilities Sector ETF (XLU) has been in a pretty good correction over the past several weeks.
Could that be coming to an end? At...
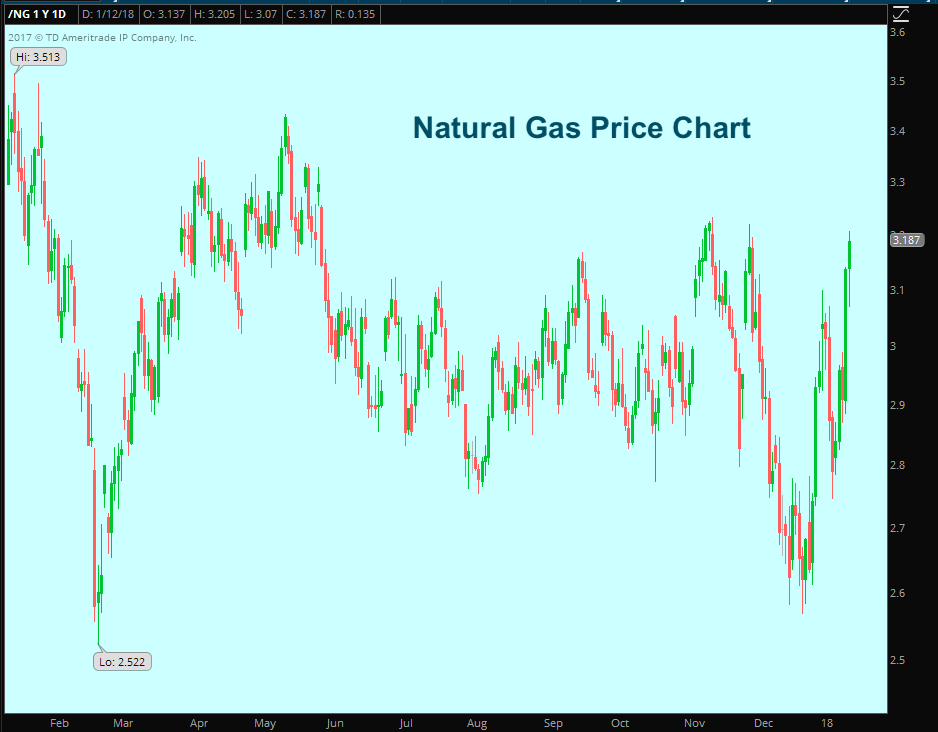
Natural Gas Update: Cold Weather Brings Heavy Demand
Prompt-month Henry Hub Natural Gas prices have traded up 30 cents in the last 2 days as cold weather looms next week.
And this comes...
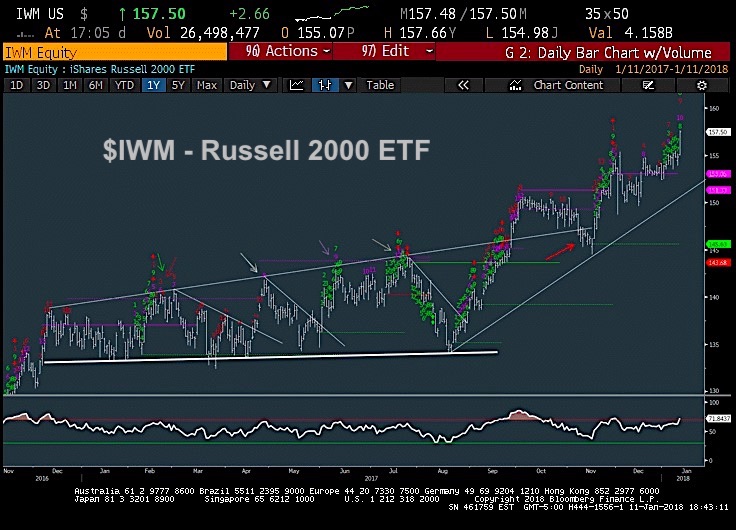
Russell 2000 Spotlight: Small Cap Stocks Outperforming
The Russell 2000 and small (and micro) cap stocks have been outperforming of late.
This pick up in near-term strength bodes well for small caps...
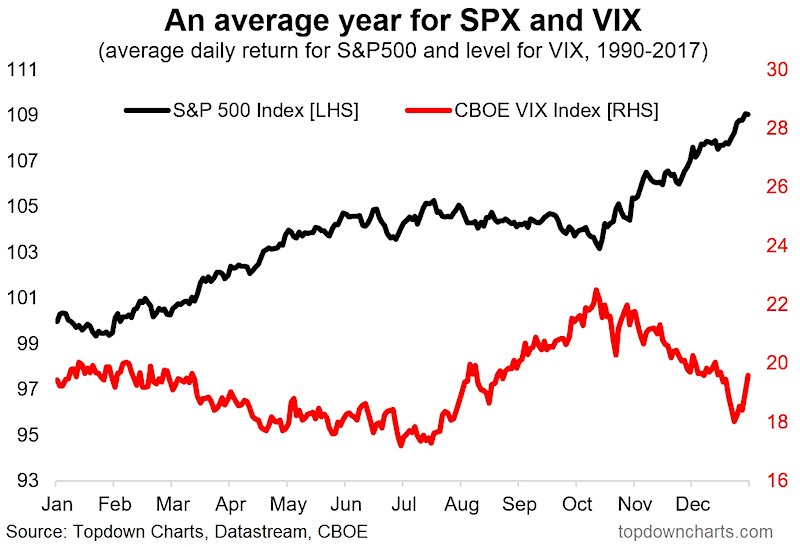
Market Seasonality Composite Charts For Stocks & Bonds
Earlier this week, I shared some stock market seasonality charts on my research blog and Twitter feed. I'd like to highlight a couple of...

