The Utilities Sector ETF (XLU) has been in a pretty good correction over the past several weeks.
Could that be coming to an end? At least from a short-term trading perspective?
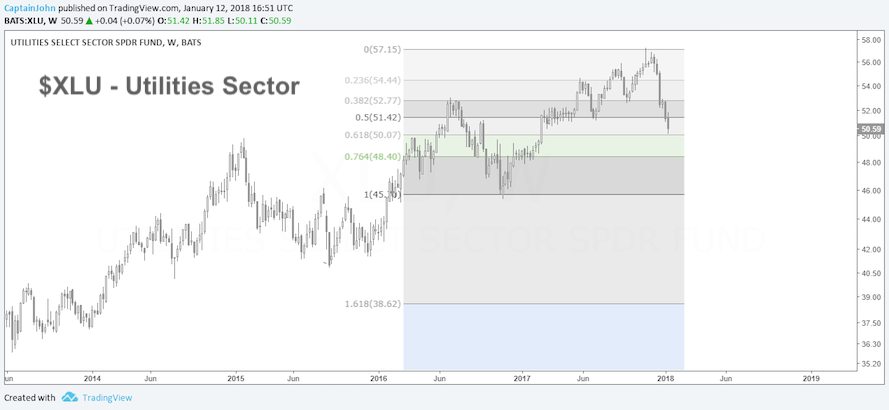
Looking at the chart below, you can see that the Utilities ETF (XLU) is holding above its 61.8% Fibonacci retracement level (…thus far).
Trend line support also intersects with this Fib support, which adds importance to the level.
I’m looking for XLU and select utilities stocks to bounce off this level. Perhaps this will coincide with a pullback as active investors look for defensive exposure. We shall see.
But keep an eye on this level!
$XLU Utilities Sector ETF – Weekly Chart
If you are interested in learning more about our investing approach and financial services, visit us at CaptainJohnCharts.
Twitter: @CptJohnCharts & @FortunaEquitis
The author has a position in the mentioned securities. Any opinions expressed herein are solely those of the author, and do not in any way represent the views or opinions of any other person or entity.


