Market Outlook for January 16, 2018
The S&P 500 and broad market indices are seeing some bullish continuation after the long holiday weekend. However, there is some technical divergence playing out. Buying on pullbacks provides the least risk today.
Note that you can access today’s economic calendar with a full rundown of releases.
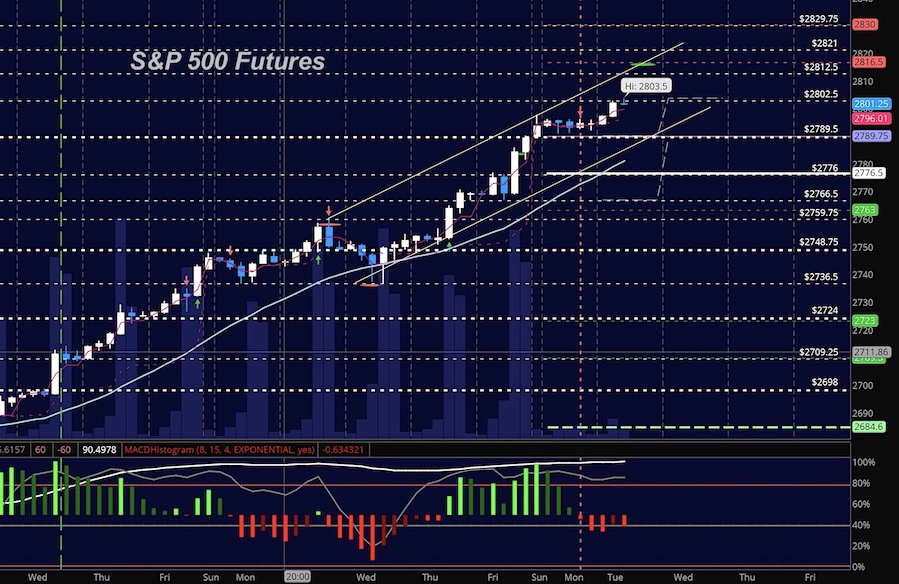
S&P 500 Futures
Support holds higher near 2789.5 with minor negative divergence. Short trades still be swift and highly countertrend, meaning that buyers will remain at regions of value to engage. Bullish formations hold well and no crosscurrents appear at this time. Watching support continue to hold will be key for all of the indices we follow. The bullets below represent the likely shift of trading momentum at the positive or failed retests at the levels noted.
- Buying pressure intraday will likely strengthen with a positive retest of 2803
- Selling pressure intraday will likely strengthen with a failed retest of 2789.5
- Resistance sits near 2801.75 to 2812.5, with 2816.5 and 2829.75 above that.
- Support holds between 2796 and 2789.75, with 2782.5 and 2776.5 below that.
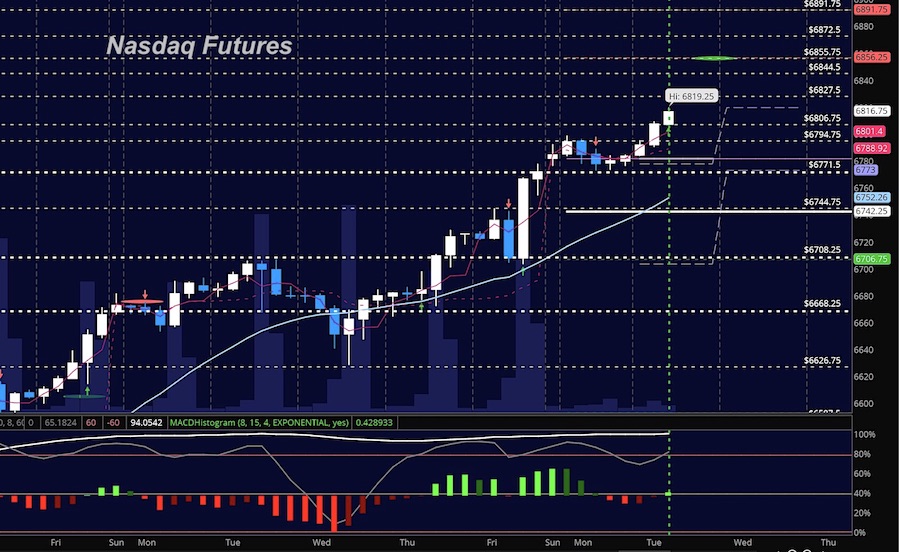
NASDAQ Futures
Today’s candles begin with more bullish momentum and new highs with the others we watch. As momentum holds steady and buyers are still aggressive, we need to keep an eye on support to hold to confirm continued upside. Failed support will mean a breakdown of buying strength. Those key levels of support look like 6794 and 6801. The bullets below represent the likely shift of intraday trading momentum at the positive or failed tests at the levels noted.
- Buying pressure intraday will likely strengthen with a positive retest of 6817.75
- Selling pressure intraday will likely strengthen with a failed retest of 6780.75
- Resistance sits near 6814.5 to 6819.75 with 6827.5 and 6856.75 above that.
- Support holds near 6801.5 and 6789.75, with 6781.5 and 6771.5 below that.
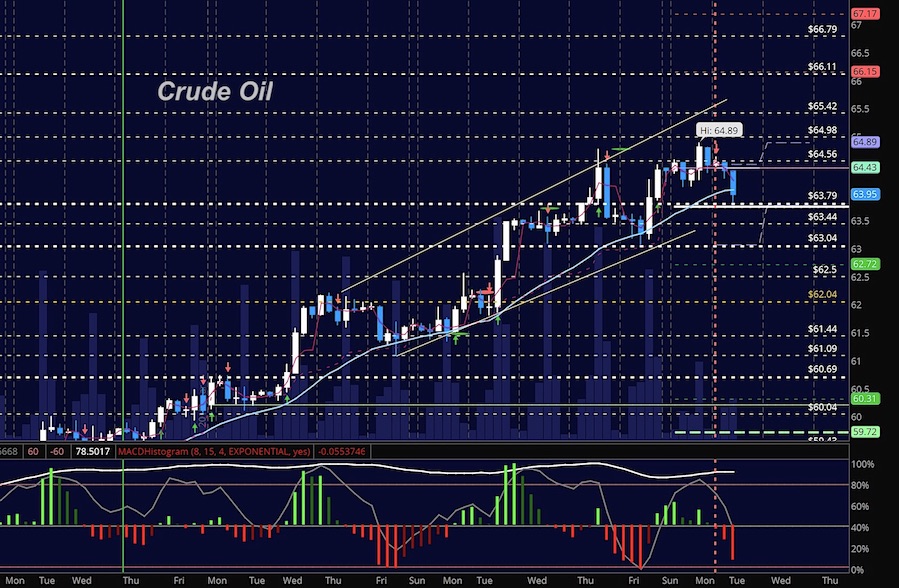
WTI Crude Oil
We continue to approach 65.4 as a key target but have faded off recent highs near 64.89. With a solid fade into 63.77, this area of support will be our zone to watch as buyers have attempted to lift us off this level. Due to the holiday, the API and EIA reports will be out one day later than normal. The bullets below represent the likely shift of trading momentum at the positive or failed tests at the levels noted.
- Buying pressure intraday will likely strengthen with a positive retest of 64.3
- Selling pressure intraday will strengthen with a failed retest of 63.67
- Resistance sits near 63.97 to 64.23, with 64.89 and 65.4 above that.
- Support holds near 63.73 to 63.44, with 63.1 and 62.73 below that.
If you’re interested in the live trading room, it is now primarily stock market futures content, though we do track heavily traded stocks and their likely daily trajectories as well – we begin at 9am with a morning report and likely chart movements along with trade setups for the day.
As long as the trader keeps himself aware of support and resistance levels, risk can be very adequately managed to play in either direction as bottom picking remains a behavior pattern that is developing with value buyers and speculative traders.
Twitter: @AnneMarieTrades
The author trades stock market futures every day and may have a position in mentioned securities at the time of publication. Any opinions expressed herein are solely those of the author, and do not in any way represent the views or opinions of any other person or entity.


