The last time we blogged about this important ratio, we highlighted an important juncture for the market’s next move.
While the targeted price level did yield support for a minor bounce, the overall market did not pay attention at all and the continued ‘risk-on’ institutional appetite continued.
This latest advance has been unrelenting. And the most recent price action on the ratio shows a strong thrust down so, inevitably, this support area appears to be at risk and will eventually fail.
If it does, then I’ve updated the ratio for the next set of possible targets.
Monthly XLP / NYSE Index Ratio
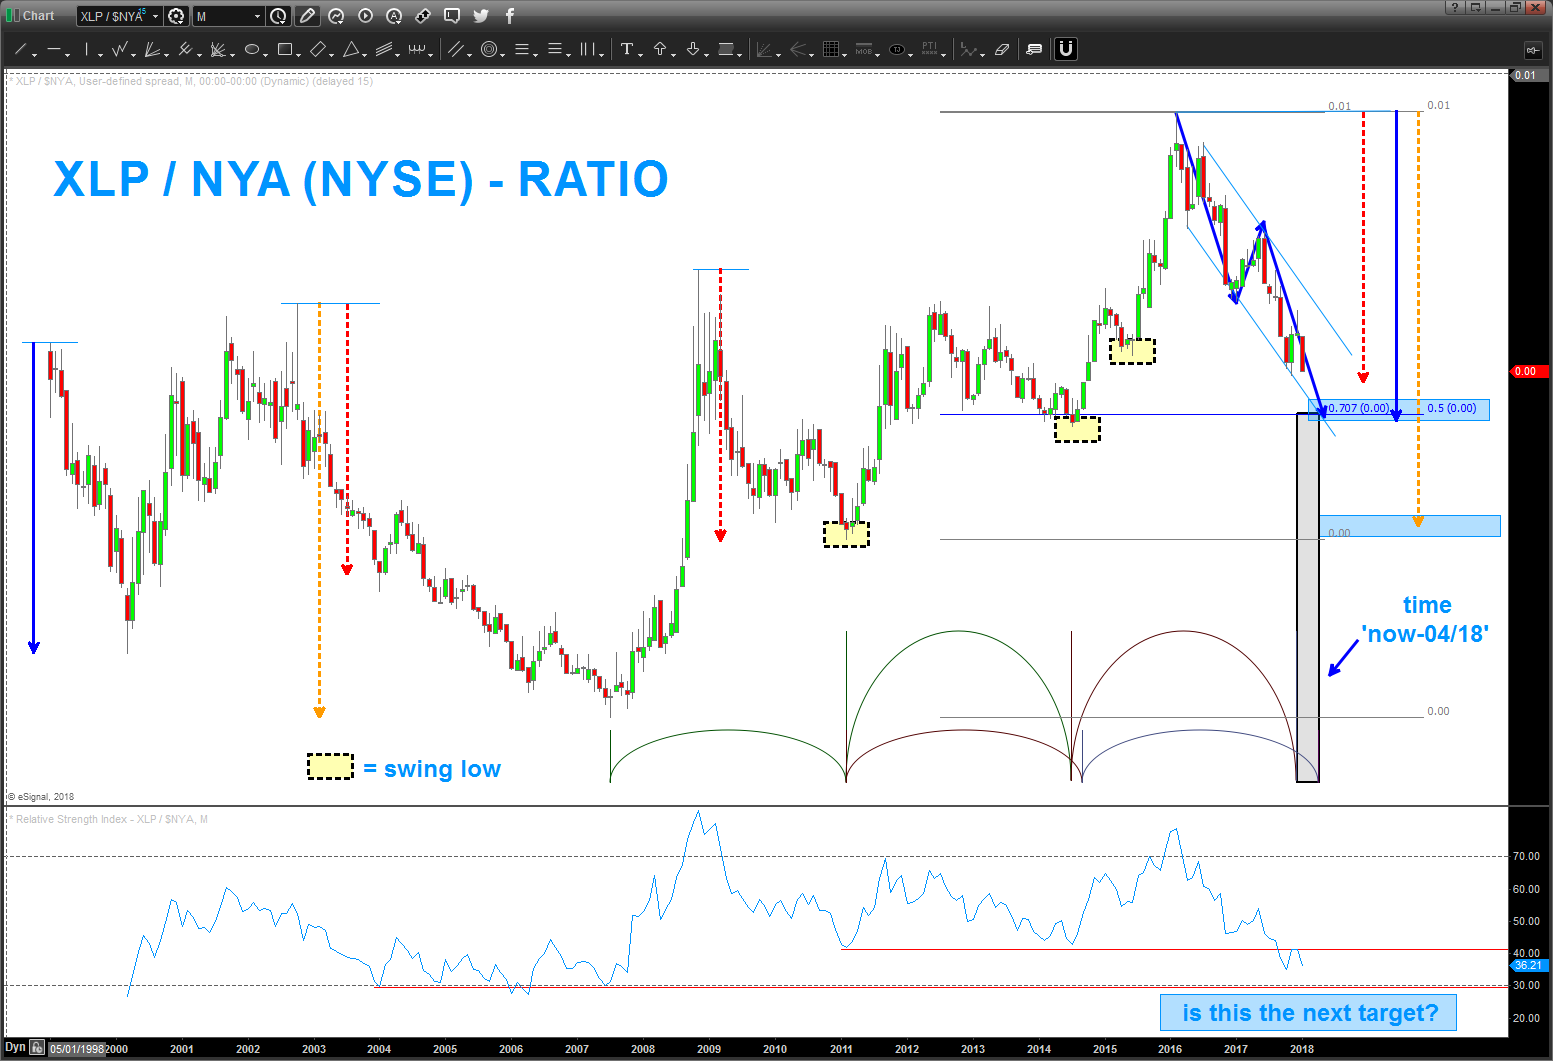
Note the following from the chart shown above:
- RSI: using the concept of ‘polarity’ it most recently went back up to the 2011 low and retested. The 2011 low on the RSI which was once support became resisted causing the move back down. The lower end of the RSI held as support from 2004-2008 while price continued down. Suspect that this area will hold the RSI at bay BUT ratio price could continue down …
- Certainly appears that we are going to target (from a price perspective) the 3 year ratio price support that held from 2011-2014
- Here we have overlapping ratio’s (.5 and .707), a ‘basic’ projection technique of AB=CD (blue arrows) and the blue measured move arrow from that is equal to the correction at the inception of XLP into the mid-2000 low.
- Note the dashed black box w/ yellow fill.
- These boxes are put on the chart to show ‘stair step’ swing lows that, since 2008 have never been broken. Appears we are going to break the swing low from 2015-2016 but one swing low break isn’t that ‘big of a deal.’ Two or more is .. again, this emphasizes the importance for the support of the ratio price as mentioned above.
- Time: using ‘basic’ time cycle tools we can see the ‘next time’ period is April 2018. Simply taking the ratio price swing lows and looking for the form and rhythm. The price DOES NOT have to hit the next projected ratio price area at that time, just showing in advance that the April 18’ time frame is important, for now.
NYSE Index
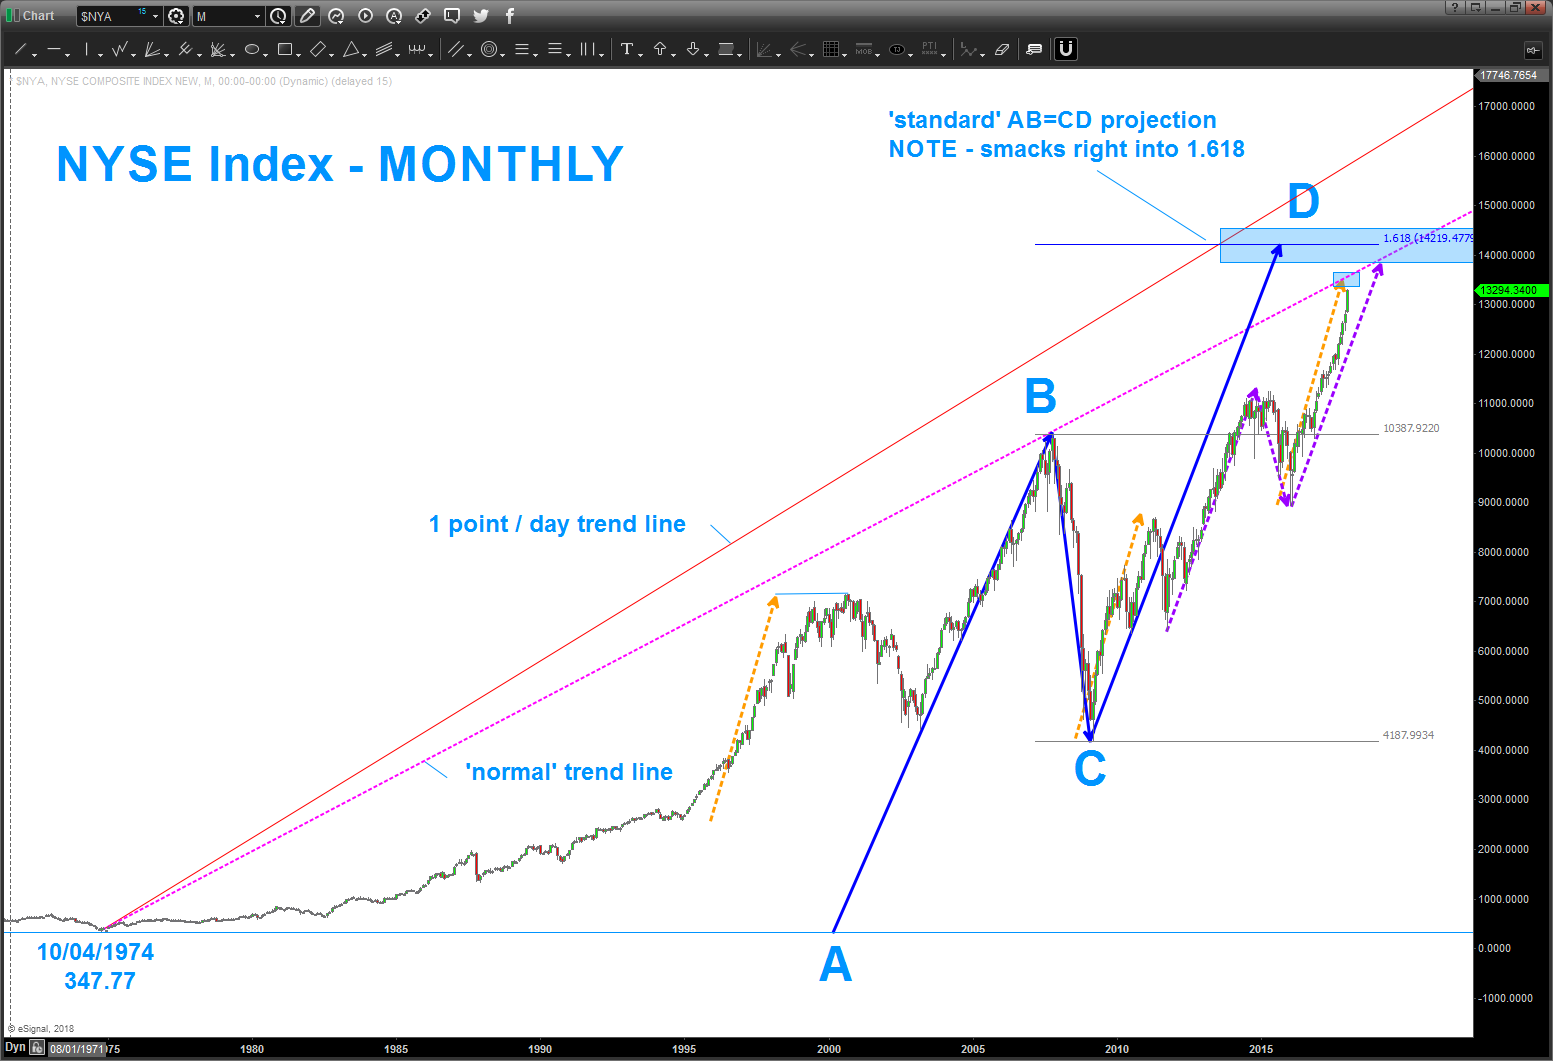
Analysis of NYSE Monthly chart:
- Using the all-time low from 1974 (shown) we can do ‘basic’ price projections and this larger AB=CD comes right into the 1.618 extension. That should be a very important resistance area …
- Additionally, connecting the 1974 low with the 2007 high shows some ‘basic’ trendline work that should be important resistance.
- Note the dashed orange arrows … they are all equal measured moves into important highs that preceded corrections.
We are long into this amazing and powerful run. Just running the numbers shows, perhaps, another 7-10% upside or, perhaps, in/around here could cause the much needed correction. Monitor the XLP / NYSE Ratio – closely for a potential first hint of the much needed correction.
Twitter: @BartsCharts
Author does not have a position in mentioned securities at the time of publication. Any opinions expressed herein are solely those of the author, and do not in any way represent the views or opinions of any other person or entity.

 Testing Important Price Support")
: Cup (and Maybe Handle) Watch")

